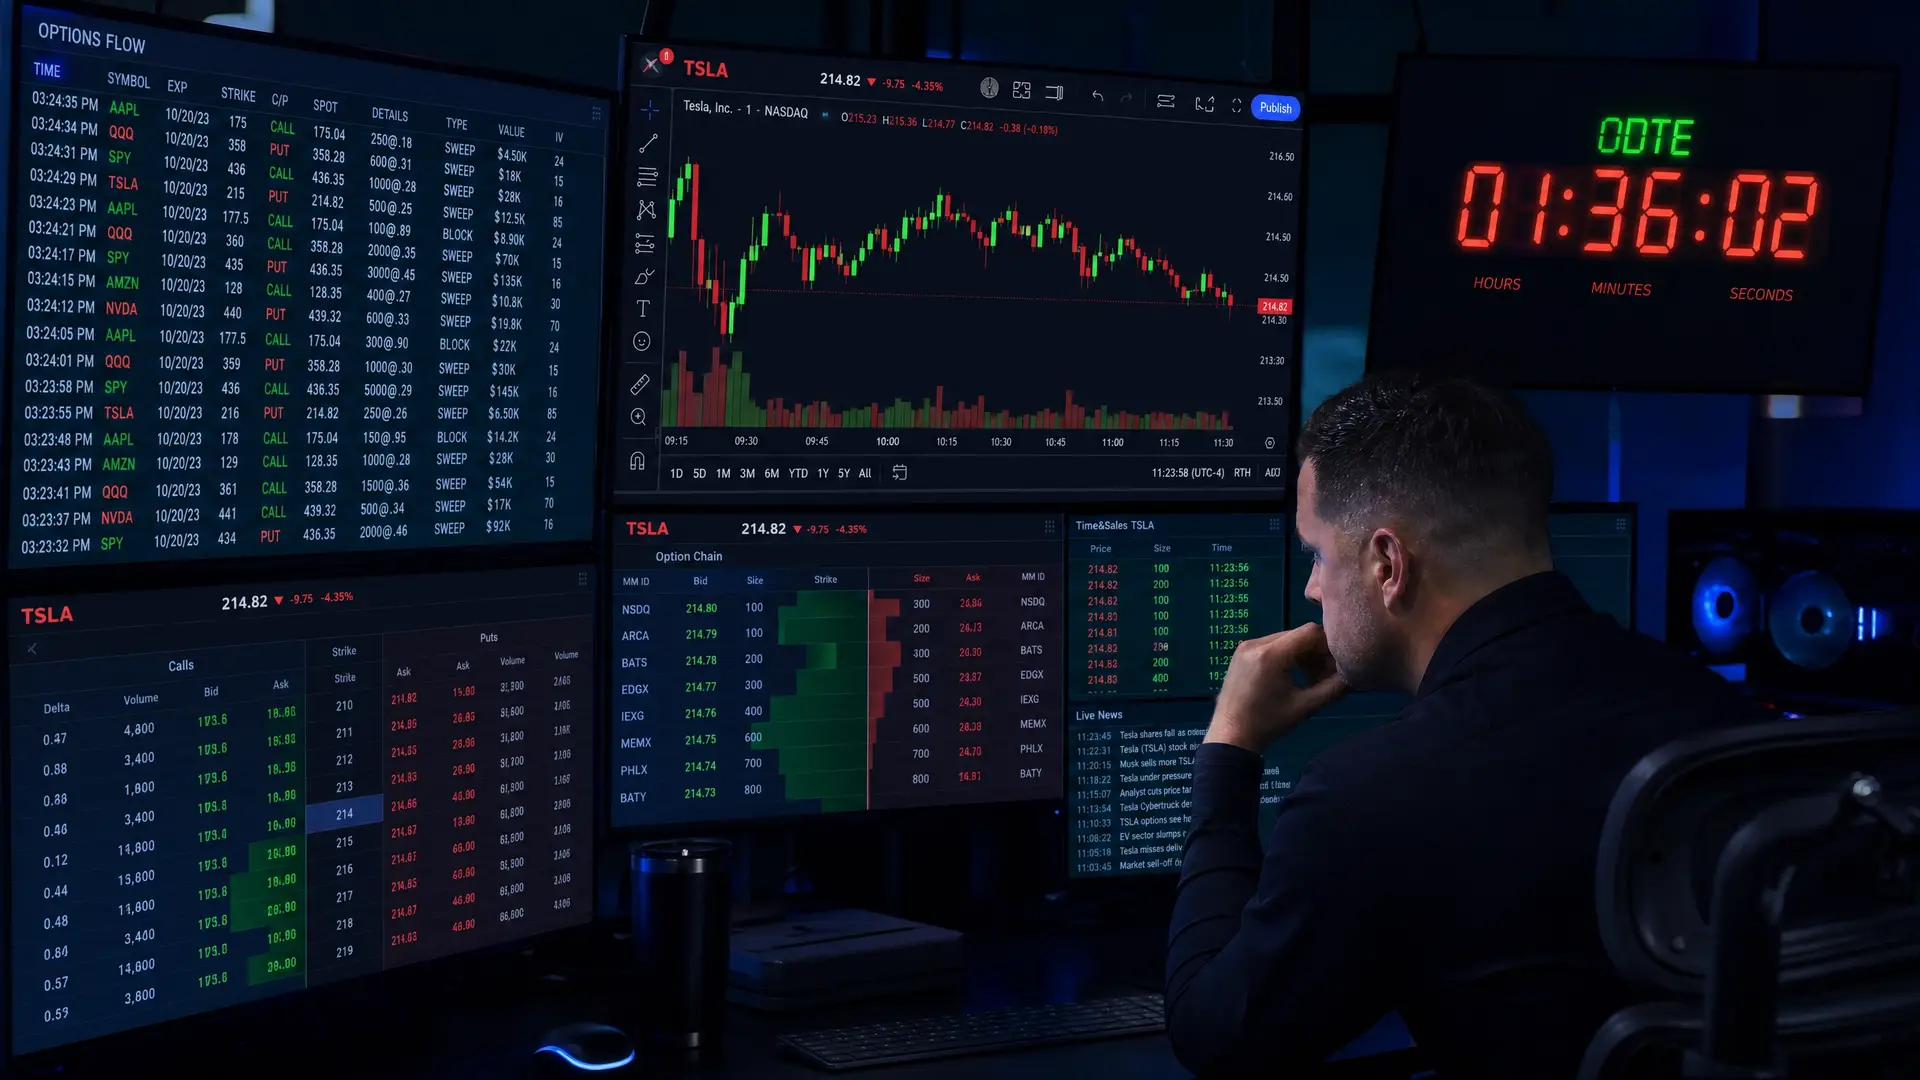
How to Trade 0DTE Options: A Step-by-Step Strategy Guide Using Order Flow
Zero days to expiration (0DTE) options have completely transformed the modern stock market. What used to be a niche trading instrument has exploded into a
Zero days to expiration (0DTE) options have completely transformed the modern stock market. What used to be a niche trading instrument has exploded into a
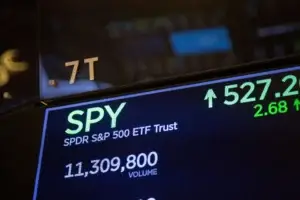
SPY leveraged ETFs offer sophisticated investors the ability to amplify their exposure to S&P 500 movements, potentially doubling or tripling daily returns without the complexity

Palladium ETFs offer investors a unique opportunity to gain exposure to one of the world’s most valuable precious metals without the complexities of physical ownership.

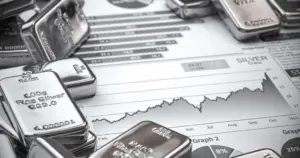
The precious metals market has been revolutionized by exchange traded funds. ETFs make gold, silver, platinum, and palladium investments accessible to everyday investors without the

As artificial intelligence and data centers drive unprecedented energy demand, natural gas has emerged as a critical bridge fuel in the global energy transition. For

Investing in crude oil has traditionally required sophisticated knowledge of futures markets or substantial capital to buy physical commodities. Crude oil ETFs have changed this
Spotting a potential trend reversal in the market can feel like finding a lighthouse in the middle of a storm. That’s where the Morning Star pattern comes

Spotting powerful trends in the market can feel like striking gold, and the bull flag pattern is one of those gems that traders swear by. It’s clean,

Copper demand is experiencing unprecedented growth as global electrification accelerates and artificial intelligence infrastructure expands worldwide. For investors seeking exposure to this critical metal without
Silver ETFs have emerged as an increasingly popular investment vehicle for investors seeking exposure to precious metals without the complexities of physical ownership. As silver

Exchange-traded products (ETPs) might sound a little intimidating at first. In reality, they’re a pretty straightforward concept, a powerful tool for investors. At their core, ETPs
For nearly a century, the S&P 500 has delivered average annual returns of about 10%, making it one of the most reliable wealth-building tools available

Gold leveraged ETFs provide sophisticated investors with amplified exposure to gold price movements. These specialized funds achieve this through derivative-based instruments that can magnify both
Technology continues to drive innovation and deliver exceptional returns for investors, making the search for the best tech ETF more crucial than ever. As the

When it comes to building a solid investment portfolio, mutual funds vs ETFs are two of the most popular choices out there. And it’s easy to see