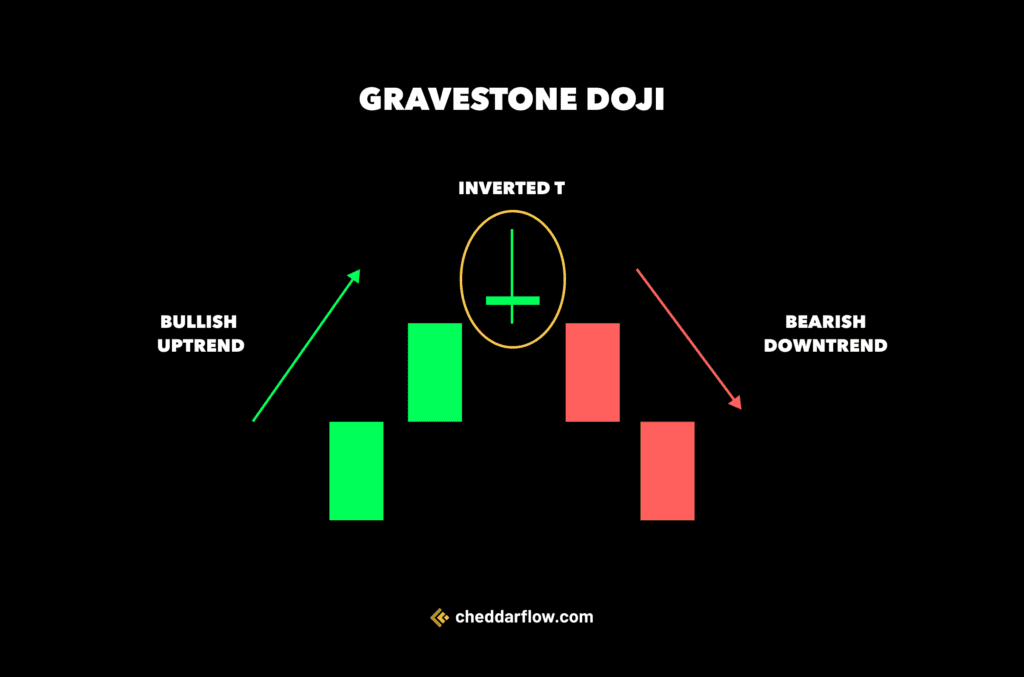
Among the myriad of technical analysis tools, the gravestone doji candlestick pattern stands out as a compelling signal of potential trend reversals. With its distinctive shape resembling an inverted “T” or a looming tombstone, this pattern often emerges at the peak of an uptrend, warning of a possible shift in market sentiment. As bulls and bears battle for control, the gravestone doji encapsulates the indecision and vulnerability that can precede a significant price movement.
What Is a Gravestone Doji?
A gravestone doji is a candlestick pattern used in technical analysis to signal a potential reversal from an uptrend to a downtrend. It looks like an inverted T with a long upper shadow, a small or nonexistent body, and a closing price near the opening price. Let’s talk more about its looks.
What does it look like?

Imagine a gravestone — a tall, thin one. That’s the basic shape of a gravestone doji candlestick pattern.
- Top: A long line sticking straight up. This is the upper shadow, showing the price getting pushed high early in the trading day.
- Body: A very short horizontal line near the bottom. This represents the closing price being close to the opening price.
- Bottom: No line at all. The price didn’t go any lower than the opening price.
What does it tell me?
The gravestone doji tells a story of a potential trend reversal. It suggests that after an uptrend, bulls push the price higher early in the session but are met by strong selling pressure.
- Bearish reversal: It suggests that an uptrend might be coming to an end, and a downtrend could be starting.
- Selling pressure: The long upper shadow indicates that there was a strong push upwards early in the trading session, but sellers came in and pushed the price back down to near the opening price.
- Indecision: The small real body reflects indecision in the market, with bulls and bears battling it out.
This pattern hints that the uptrend might be losing steam and a downtrend could be on the horizon.
Types of Gravestone Doji
| Variation | Description |
|---|---|
| Classic Gravestone Doji | Standard gravestone doji with a long upper shadow, small real body near the bottom, and minimal lower shadow. Resembles an inverted T. |
| Long-Legged Gravestone Doji | Extended upper shadow compared to the classic version, potentially strengthening the bearish signal. However, confirmation from other indicators is still crucial. |
| Small Body Gravestone Doji | Very small real body, emphasizing market indecision. Doesn’t significantly alter the overall bearish reversal signal. |
The Gravestone Doji is a singular pattern, but analysts may discuss variations based on shadow length or body size. These variations don’t change the core meaning – a potential trend reversal from up to down – but can add emphasis to the underlying message.
How to Trade the Gravestone Doji
To trade a gravestone doji, identify the pattern during an uptrend and confirm with a subsequent bearish candlestick. Enter a short position if prices drop below the doji’s low, setting a stop-loss above its high to manage risks.
1. Locate it

Identify the gravestone doji during an uptrend.
Confirm its potential reversal significance with the next candlestick showing bearish movement.
2. Stop-Loss
Enter a short position if the price drops below the low of the gravestone doji. Set a stop-loss above its high to limit potential losses if the trend reverses back upwards.
Related: When to set up a stop-loss.
3. Monitor & Adjust
Keep a close watch on the trade. Adjust the stop-loss to protect gains or to minimize losses if the market dynamics change unexpectedly.
Real-Life Example

A notable example of a gravestone doji occurred in the chart of Apple Inc. (AAPL) on April 29, 2024.
On this day, Apple‘s stock opened and closed at nearly the same price point, with the day’s trading reaching a high significantly above the open and close before settling back near the opening price.
- This pattern suggested uncertainty among traders and investors, leading some to speculate about a possible change in market direction following the stock’s recent uptrend.
- This example illustrates how the gravestone doji can signal hesitation in a market otherwise inclined to push higher, providing a visual cue for potential shifts in market sentiment.
Important: The Limitations
While the gravestone doji can be a valuable part of a trader’s toolkit, it should be used in conjunction with other technical analysis tools and within a well-considered trading strategy.
| Limitation | Description |
|---|---|
| False Signals | May produce misleading signals, leading to incorrect predictions about market reversals. |
| Confirmation Necessity | Requires additional bearish indicators post-appearance to confirm the potential for a reversal. |
| Context Dependence | Effectiveness varies greatly depending on market conditions and its context within the price trend. |
| Limited Predictive Power | Indicates possible reversals without providing specifics on the duration or strength of the move. |
| Market Noise | Can appear frequently in volatile markets, potentially leading to confusion and unreliable signals. |
This table highlights key considerations for traders.
Frequently Asked Questions
What does a gravestone doji indicate?
A gravestone doji is a candlestick pattern in stock charts that typically indicates a potential reversal from bullish to bearish sentiment. It forms when the open, low, and close prices are roughly the same, and there’s a long upper shadow, suggesting buyers failed to maintain control.
Is it bullish or bearish?
A doji candlestick by itself is considered neutral, indicating indecision between buyers and sellers in the market. Its interpretation as bullish or bearish depends on the preceding price action and the candlestick’s position within the broader market trend.
Is doji a reversal?
A doji can signal a potential price reversal, but it primarily indicates market indecision. Whether it suggests a bullish or bearish reversal often depends on its placement within an existing price trend and confirmation from subsequent price action.


