
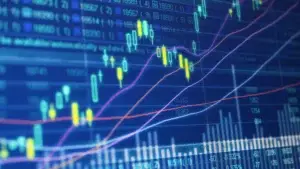
Understanding Day Trading on Robinhood
Day trading on Robinhood is all about seizing those quick market moves. It’s the practice of buying and selling securities within the same day. Day
Day trading on Robinhood is all about seizing those quick market moves. It’s the practice of buying and selling securities within the same day. Day

Understanding Options Trading Options trading boosts your trading strategies. You buy and sell options contracts that track stocks and ETFs. This gives you a flexible

The VIX Index is a key tool for gauging market sentiment and expected volatility. Here’s what you need to know: VIX readings typically fall into
In the ever-evolving landscape of financial markets, traders are constantly seeking innovative approaches to gain an edge. One such strategy that has gained traction in

Institutional trading is the large-scale buying and selling of securities by big entities like mutual funds and banks, which can significantly impact market prices. What
What is a Bullish Engulfing Pattern? A bullish engulfing pattern is a technical analysis indicator of a potential reversal from a downtrend to an uptrend.

In the intricate world of technical analysis, the diamond chart pattern stands out as a compelling indicator of potential market reversals. This distinctive formation, characterized

The Bear Flag, serves as a powerful indicator for traders looking to capitalize on downtrends. This expert guide delves into the intricacies of the Bear

Recognizing patterns that signal potential market reversals is crucial for making informed decisions. One such pattern is the Inverted Hammer candlestick, which often appears at

Among the myriad of technical analysis tools, the gravestone doji candlestick pattern stands out as a compelling signal of potential trend reversals. With its distinctive

For options traders, few phenomena are as feared or misunderstood as implied volatility (IV) crush. This sudden and dramatic drop in an option’s value, often

In the tumultuous seas of financial markets, traders are always on the lookout for reliable signals to navigate the ebb and flow of asset prices.

The cup and handle pattern, a classic chart formation that has captivated traders for decades, is like a beacon in the often turbulent sea of

In the ever-fluctuating world of financial markets, traders and investors constantly seek reliable tools to navigate the complex landscape of price movements. Among the myriad
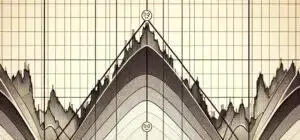
The Triple Top pattern stands as a sentinel at the peak of market trends, signaling a potential shift from bullish exuberance to bearish caution. This