The cup and handle pattern, a classic chart formation that has captivated traders for decades, is like a beacon in the often turbulent sea of financial markets. This timeless pattern, resembling a humble tea cup, has the power to reveal potential bullish trends and provide traders with a compass to navigate the complexities of stock charts. As simple as it may appear, the cup and handle is a deceptively powerful tool that can help identify opportunities for profitable trades. In this comprehensive guide, we’ll dive deep into the intricacies of this fascinating pattern, exploring its formation, the psychology behind it, and practical strategies to trade it effectively in the dynamic world of stocks and beyond.
What is the Cup & Handle Pattern?
The cup and handle is a technical analysis pattern used in stock and financial markets to identify potential price movements. It resembles a cup with a handle, where:
- The cup is a U-shaped price movement, like a rounded bottom. This indicates a price decline followed by a recovery, but not quite reaching the previous high.
- The handle is a smaller, downward trend following the cup. It signifies a consolidation period after the price increase in the cup.
It is a popular tool for technical analysts to spot potential buying opportunities and predict future price movements. However, it’s important to remember that technical analysis is not an exact science, and other factors can influence stock prices.
Formation of the pattern
It is a bullish signal that suggests a potential upward movement in the price of a security.
Here’s a breakdown of what the cup and handle pattern indicates:
- Bullish continuation or reversal: It can signal either a continuation of an existing uptrend or a reversal from a downtrend.
- Consolidation period: The cup shape represents a period of consolidation after a price increase, where the price trades sideways and investors are weighing their options.
- Buying opportunity: The handle signifies a potential buying opportunity, as the price dips slightly before resuming its upward climb.
- Breakout: A breakout from the handle’s trading range is considered a confirmation of the bullish trend, indicating that the price is likely to continue rising.
How to Trade the Cup & Handle Pattern
1. Identifying the Pattern
- Shape: Look for a U-shaped cup followed by a short, downward trend forming the handle.
- Trend: The cup and handle typically appears during an uptrend, signaling a continuation of the upward price movement.
- Neckline: Draw a horizontal line across the highs of the cup, forming the neckline. This is a key support level.
- Volume: Ideally, volume should be higher during the cup formation and lower during the handle, indicating consolidation.
2. Entering the Trade
- Breakout: Wait for the price to break above the neckline, ideally with a surge in volume. This signifies a potential breakout and continuation of the uptrend.
- Stop-Loss: Place a stop-loss order below the neckline, limiting your downside risk.
3. Target Price
- Measured Move: A common method is to measure the height of the cup and add it to the breakout point. This gives you a potential target price.
Real Example of the Pattern
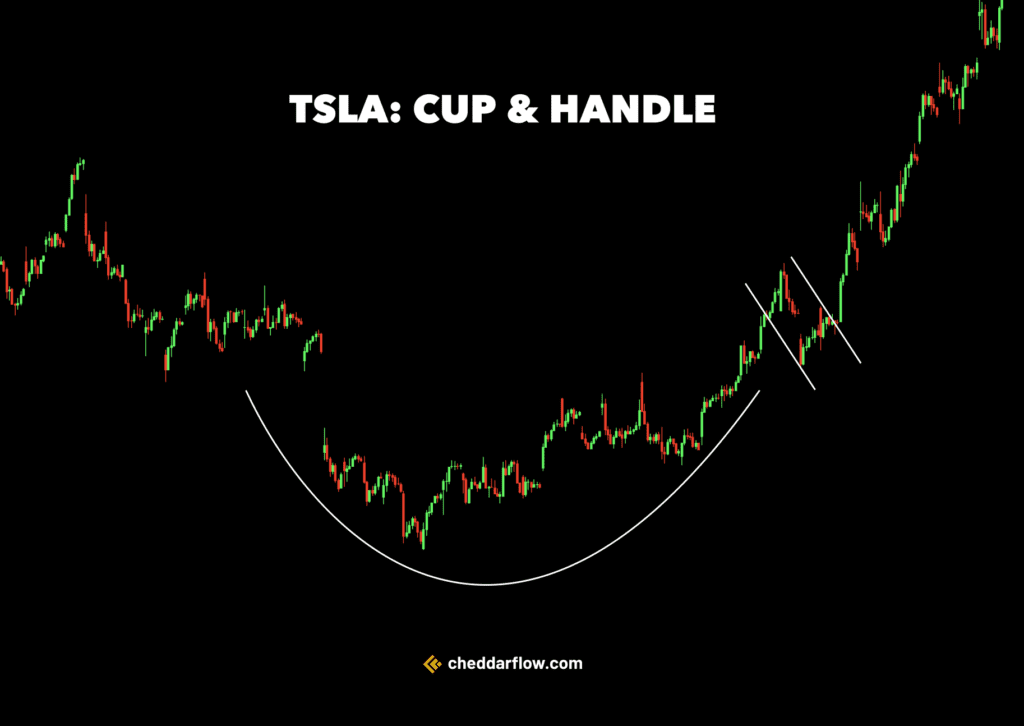
Let’s talk about a classic example: Tesla, Inc. (TSLA).
Back in 2020, Tesla’s stock chart displayed a pretty neat cup and handle pattern.
- Cup Formation: Around early 2020, Tesla’s stock price started rising, peaking in February, then dipped down forming the “cup” bottom around March due to the market’s reaction to global events, and climbed back up by August, completing the cup shape.
- Handle Formation: After the cup was formed, the stock experienced a slight dip and sideways movement, creating the “handle” part of the pattern. This phase didn’t last very long for Tesla, as the anticipation around its Battery Day event and other positive news helped maintain investor interest.
- Breakout: The “handle” concluded with a significant breakout to the upside in late 2020, driven by strong sales numbers, stock splits, and inclusion in the S&P 500, among other factors.
This pattern was a textbook example because it showed the consolidation phase after a strong uptrend, followed by a breakout, which is what traders often look for with the cup and handle pattern.
Benefits & Limitations:
Overall, the cup and handle pattern can be a valuable tool for technical traders. However, it is important to be aware of its limitations and to use it in conjunction with other forms of analysis.
Let’s see why.
1. Pros
- Identifies Potential Uptrends: The cup and handle is a bullish pattern, which means it suggests that prices are likely to rise. This can be helpful for traders who are looking to buy stocks or other assets that are expected to appreciate in value.
- Relatively Simple to Identify: Compared to some other technical indicators, the cup and handle is a fairly straightforward pattern to identify on a chart. This makes it accessible to both new and experienced traders.
- Provides Potential Entry and Target Levels: The cup and handle pattern can provide traders with two important levels:
- Entry Level: A breakout above the handle’s high is often seen as a signal to buy the asset.
- Target Level: The measured move technique suggests a price target equal to the height of the cup added to the breakout point.
2. Cons
- Not Guaranteed: Like all technical indicators, the cup and handle pattern is not a foolproof way to predict future price movements. There is always the possibility that the price will break down below the handle instead of up above it.
- Subjectivity in Interpretation: There can be some subjectivity in how traders define the cup and handle pattern. This can lead to missed opportunities or false signals.
- Time Consuming: Waiting for a complete cup and handle pattern to form can take a significant amount of time. This can be frustrating for traders who are looking for more immediate opportunities.
Conclusion
In conclusion, the cup and handle pattern remains a powerful tool in the arsenal of technical traders, offering a glimpse into the psychology of the market and the potential for profitable trades. While it is not a crystal ball, its enduring popularity is a testament to its usefulness in identifying bullish trends and breakout opportunities. As with any technical analysis tool, it is most effective when used in conjunction with other forms of analysis and risk management strategies.
Frequently Asked Questions
Is cup and handle bullish?
Yes, the cup and handle is a bullish pattern in technical analysis. It signals a potential continuation or increase in price.
- The “cup” portion represents a price decline followed by a rebound, forming a rounded bottom.
- The “handle” is a minor pullback after the rebound that doesn’t fall below the bottom of the cup.
A breakout above the handle’s high is often seen as a confirmation of the bullish signal.
How reliable is cup and handle?
Some sources claim a high success rate, particularly in bull markets, with figures like 90-95% success rate for continuation of an uptrend
Reality:
- No technical indicator is perfect, and the cup and handle is no exception. It doesn’t guarantee a price increase.
- Markets can be unpredictable, and breakouts can fail.
What is the difference between a cup and handle and a saucer?
The cup and handle and saucer pattern are very similar, but with a key distinction:
- Cup and Handle: Bullish continuation, shorter timeframe, distinct handle.
- Saucer: Bullish reversal, longer timeframe, no handle.