Supply and demand trading is a cornerstone strategy in the financial markets, leveraging the fundamental economic principles of supply exceeding demand leading to price drops, and demand exceeding supply causing price increases. This strategy is applicable across various asset classes, including stocks, commodities, and forex, making it a versatile tool for traders.
What is Demand and Supply Trading?
Demand and supply trading is a technical analysis strategy that identifies areas on a price chart where supply and demand imbalances are likely to cause price reversals. These imbalances are created by traders who are willing to buy (demand) or sell (supply) an asset at a certain price.
Supply and demand trading is a popular technical analysis strategy that can be used to trade a variety of assets, including stocks, commodities, and forex. However, it is important to note that no trading strategy is perfect, and there is always the risk of losing money.
Supply Zones
Supply zones are characterized by an abundance of sellers in the market, leading to a decrease in prices. This situation arises when the amount of supply surpasses the level of demand, prompting sellers to lower their prices to attract buyers
Demand Zones
On the flip side, demand zones denote regions characterized by a surplus of buyers, leading to an increase in price. This situation arises when demand surpasses supply, prompting traders to purchase at elevated prices.
Types of Supply & Demand patterns
There are two main types of supply and demand patterns: reversal patterns and continuation patterns.
Let’s explore both.
Reversal
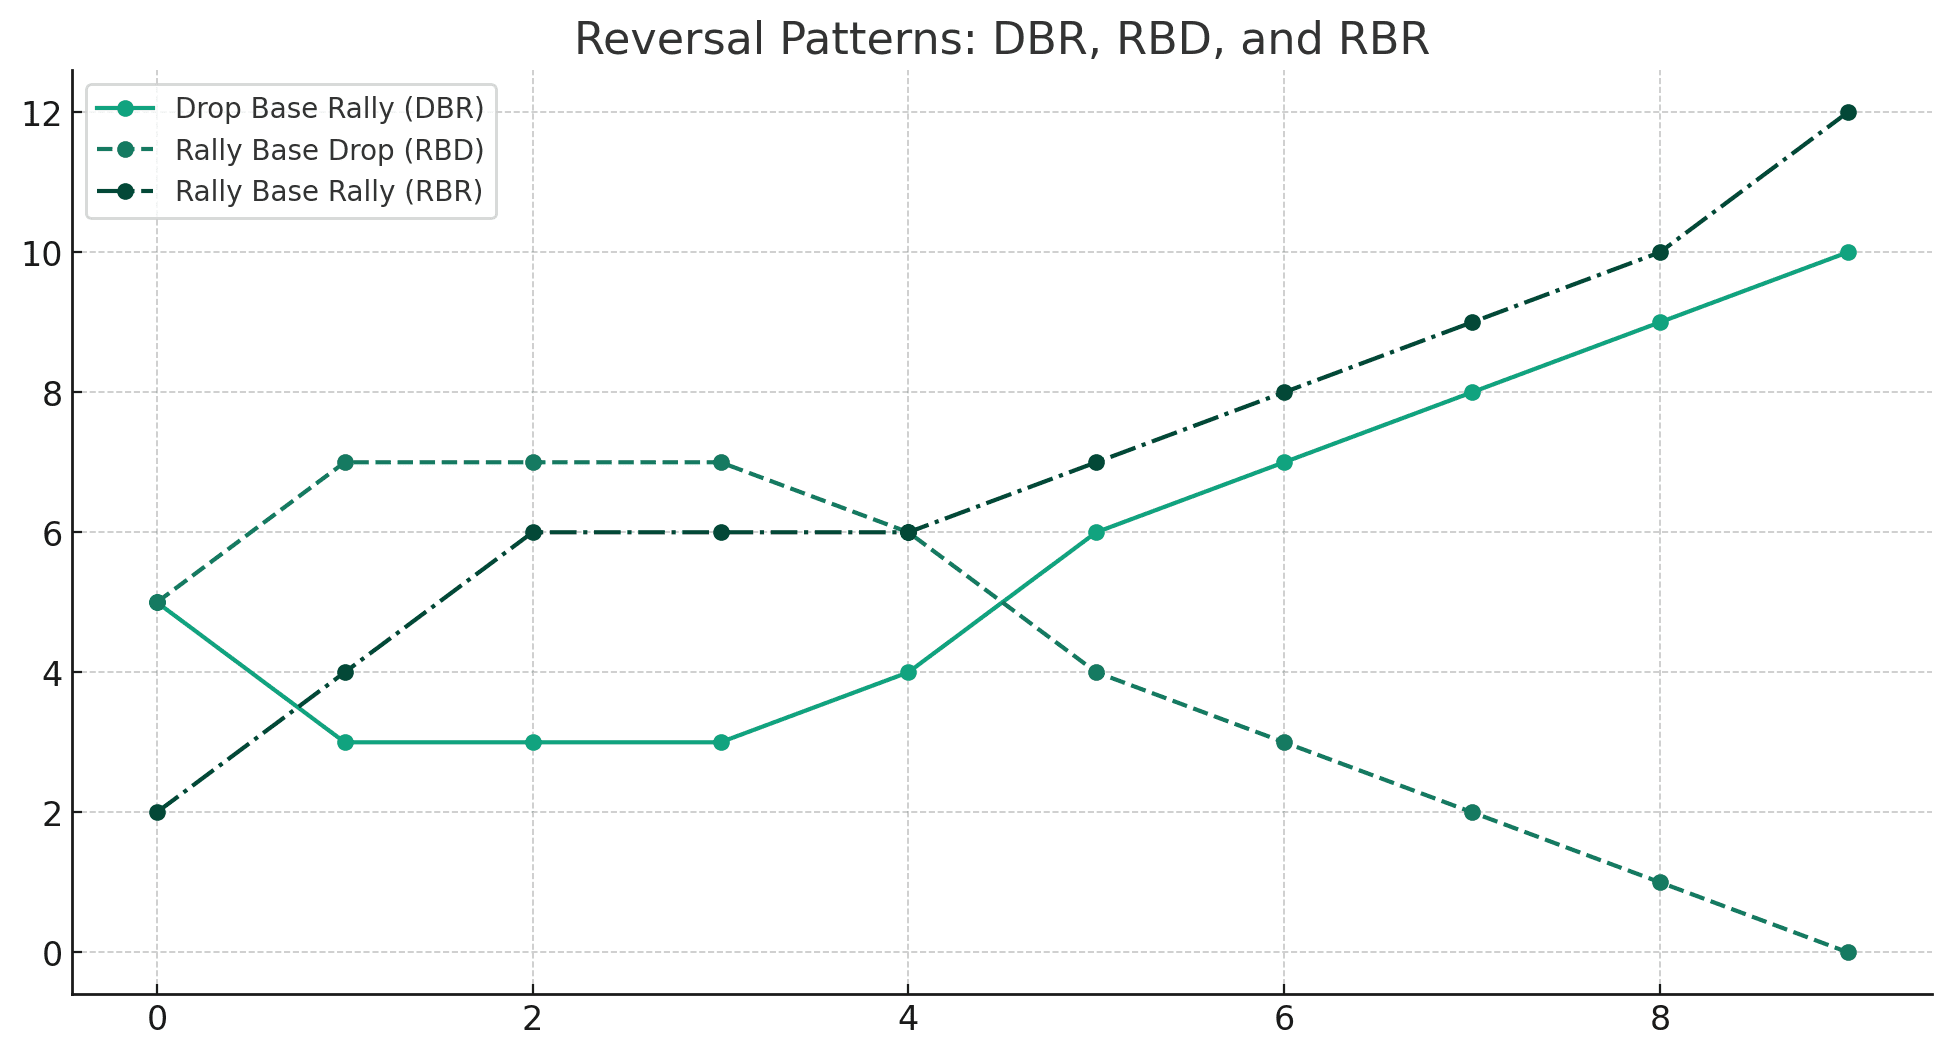
Drop base rally (DBR): This pattern occurs after a downtrend. The price drops, forms a base, and then rallies up.
Rally base drop (RBD): This pattern occurs after an uptrend. The price rallies, forms a base, and then drops down.
Rally base rally (RRR): This pattern is a strong bullish reversal pattern. The price rallies, forms a base, and then rallies again for an even larger move up.
Continuation
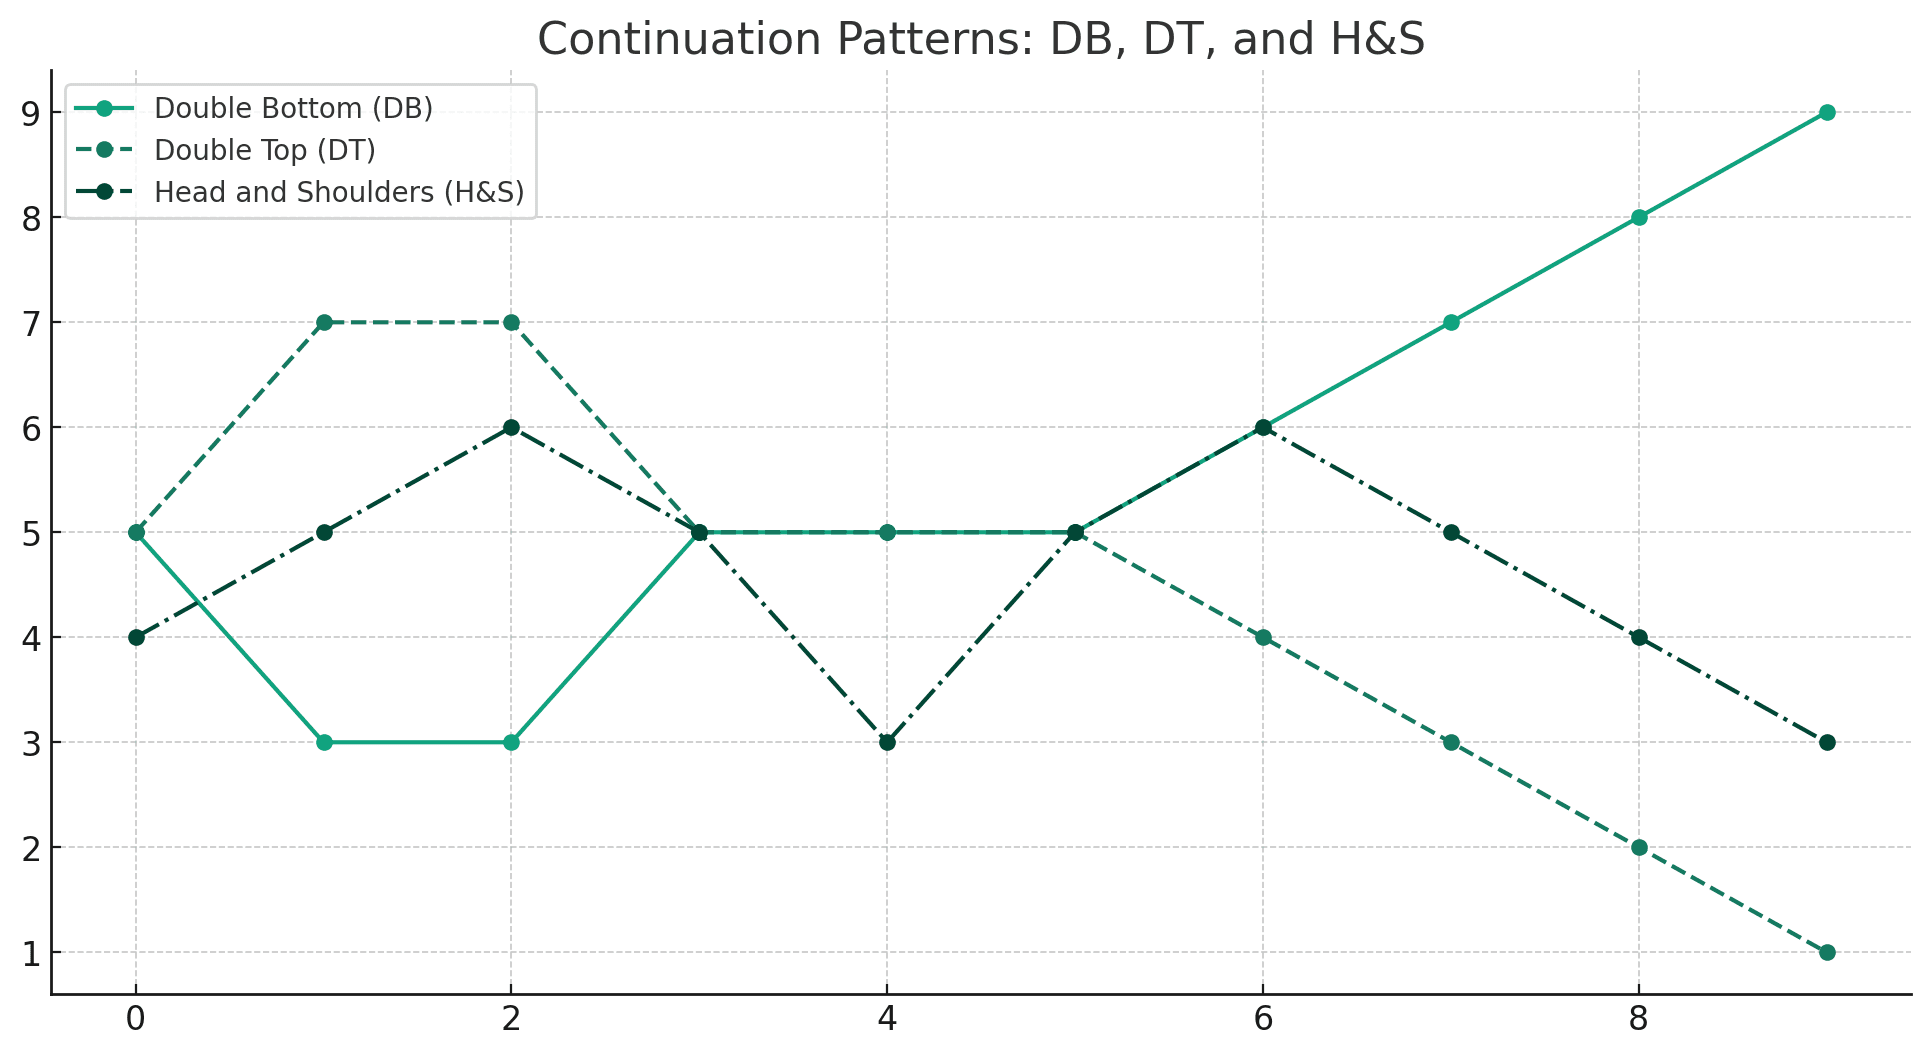
Double bottom (DB): This pattern occurs after a downtrend. The price forms two bottoms, and then rallies up.
Double top (DT): This pattern occurs after an uptrend. The price forms two tops, and then drops down.
Head and shoulders (H&S): This is a bearish continuation pattern. The price forms three peaks, with the middle peak being the highest. The price then drops below the neckline, which is a line connecting the two troughs.
Related Article: Inverse Head And Shoulders Pattern
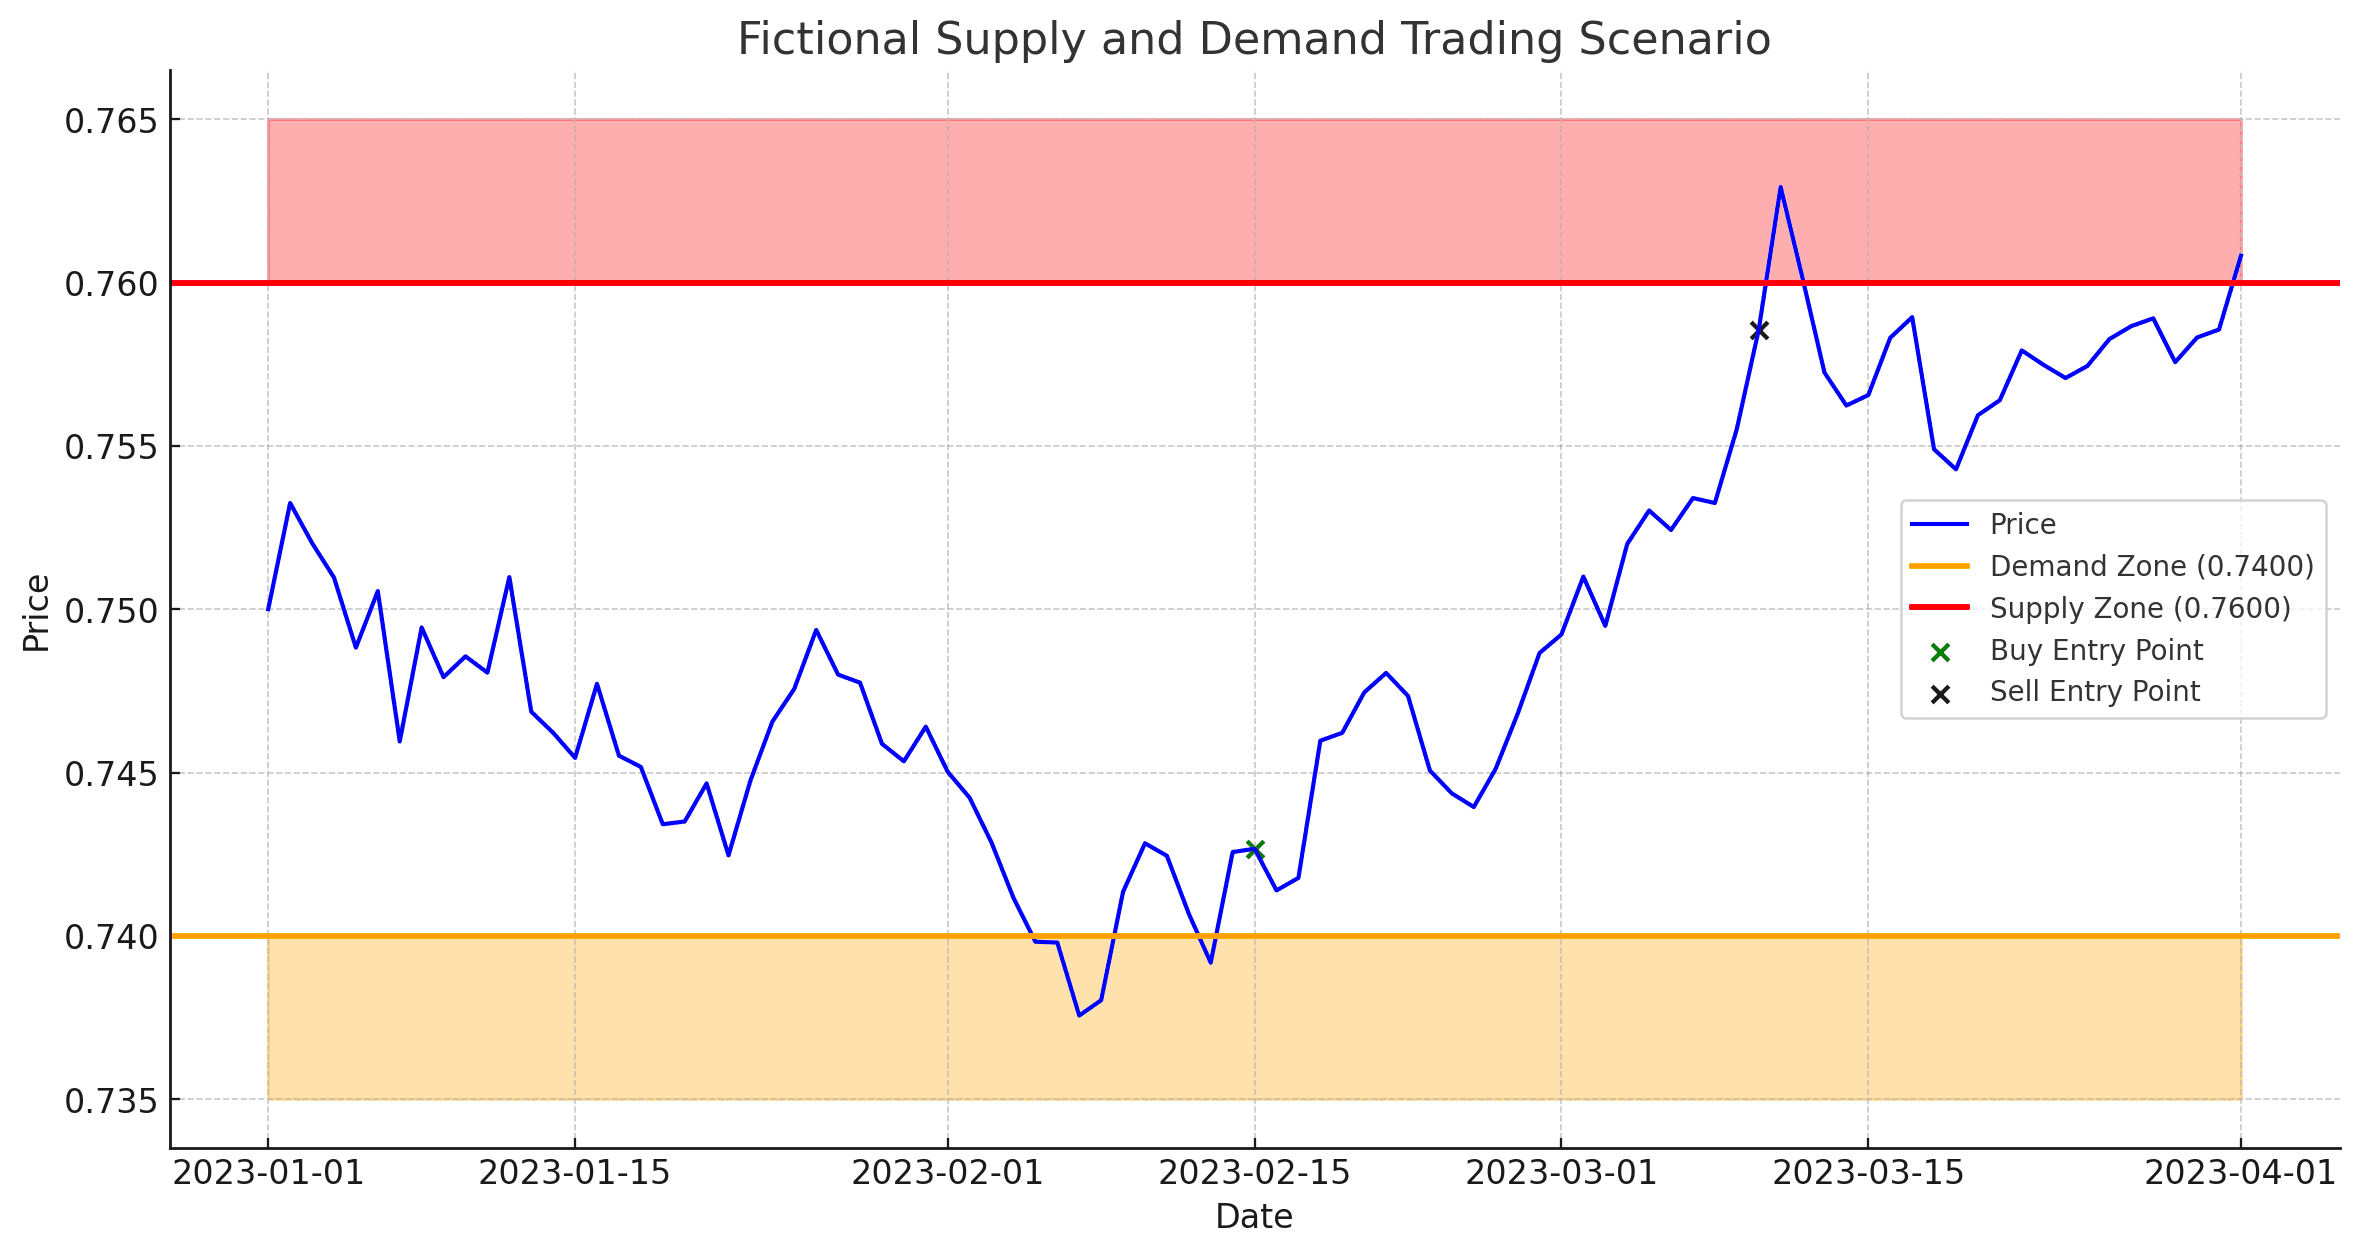
How to Identify Supply and Demand zones
Identifying supply and demand zones is like spotting where buyers and sellers hang out most in the market.
Some things to consider:
Spot the Basics: Supply zones are where sellers are likely to enter the market and push prices down. Demand zones are where buyers are likely to enter the market and push prices up.
Swing Points: Look for significant swing highs and lows on the chart. These are the peaks and troughs where price has made a noticeable move up or down.
Price Reversal Areas: Identify areas where price has reversed sharply, indicating strong buying or selling interest. These are potential supply or demand zones.
Consolidation Zones: Sometimes, supply and demand areas form during consolidation periods – where price moves sideways before breaking out sharply.
Volume Confirmation: High trading volume at the reversal points can confirm the strength of a supply or demand zone.
Freshness: The first retest of a supply or demand zone is often the most reliable. Zones can weaken with more touches.
Time Frame: Analyze multiple time frames to ensure the zones you identify are significant across short and long-term trends.
These zones give you an area of interest, not an exact price point.
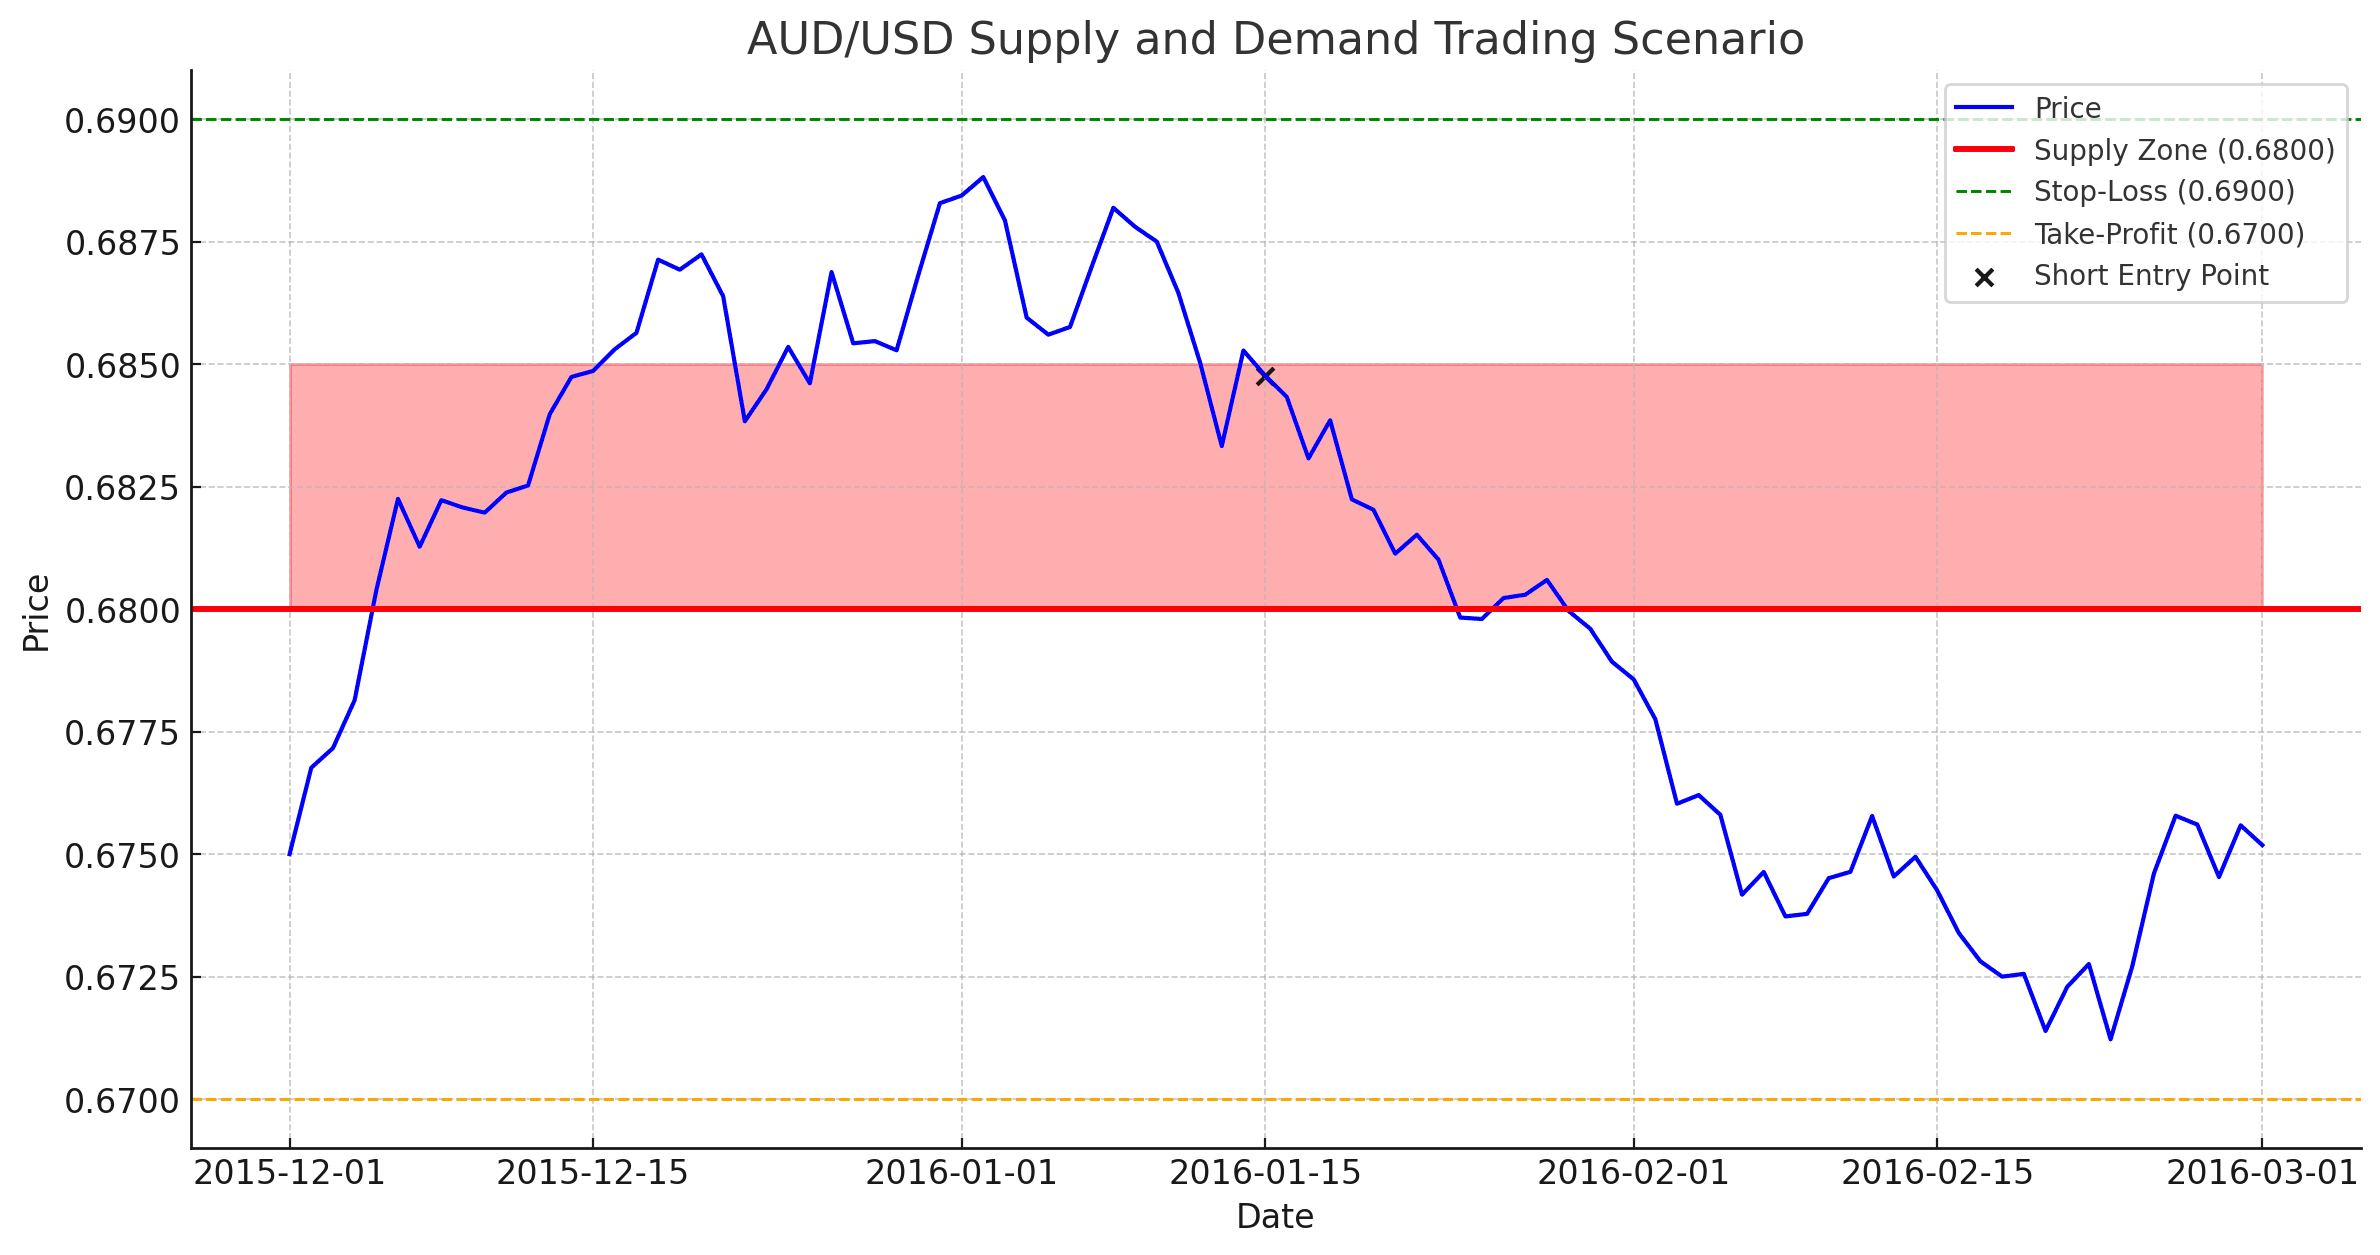
Real Example: AUD/USD Supply & Demand Trading
Let’s simulate a supply and demand trading scenario. We’ll take it step-by-step.
Identifying the Supply Zone
On the AUD/USD daily chart, we can identify a large supply zone at 0.6800. This zone is marked by a large area of congestion on the price chart, and the price has stalled near this level on several occasions.
Waiting for Price to Approach the Supply Zone
We will wait for the price to approach the supply zone before entering a trade. In this case, the price approaches the supply zone in early 2016 and then bounces off of it.
Entering a Short Trade
Once the price has bounced off of the supply zone, we will enter a short trade. This means that we are betting that the price will continue to fall.
Setting a Stop-Loss Order
We will place a stop-loss order above the supply zone, just in case the price breaks out and continues to rise. In this case, our stop-loss order would be placed at 0.6900.
Setting a Take-Profit Order
We will place a take-profit order at a profit target of 0.6700. This means that we will lock in our profits if the price falls to our target price.
The Trade
In this case, the price falls below our stop-loss order and we exit the trade with a loss. However, this is just one example, and there are many other times when supply and demand trading can be used to make profitable trades.
10 Successful Tips For Supply & Demand Trading
Use multiple timeframes: Supply and demand zones can be found on all timeframes, from the daily chart to the hourly chart. By looking at a variety of timeframes, you can identify more reliable zones.
Use volume: Volume is the measure of the number of trades that have been executed. High volume near a supply or demand zone suggests that it is a strong zone.
Use Fibonacci retracements: Fibonacci retracements can be used to identify potential supply and demand zones. Common retracement levels include 38.2%, 50%, and 61.8%.
Use order flow analysis: Order flow analysis can provide you with additional information about supply and demand zones. This information can help you to make more informed trading decisions.
Don’t trade every zone: Not all supply and demand zones are created equal. Only trade zones that have a high probability of success.
Use stop-loss orders: Stop-loss orders can help you to limit your losses if the trade goes against you.
Don’t overtrade: Trading too frequently can lead to losses. Only trade when you have a clear trading plan.
Use a combination of tools: There are a number of different tools that can be used to identify supply and demand zones. It’s important to use a combination of these tools to get the most accurate picture of the market.
Be patient: Supply and demand trading is not a get-rich-quick scheme. It takes time and patience to learn how to trade these zones effectively.
Practice: The best way to learn how to trade supply and demand zones is to practice. There are a number of free online trading platforms that you can use to practice your trading skills.
By following these tips, you can increase your chances of success in the market.
Pros & Cons: Supply and Demand Trading
Traders should use them in conjunction with other technical analysis tools and should be aware of their limitations.
Pros
Versatility: Supply and demand zones can be used to trade a variety of assets, including stocks, commodities, and forex.
Effectiveness: Supply and demand zones can be a very effective trading tool, and many successful traders use them to make money.
Relevance: Supply and demand zones are based on fundamental economic principles, so they are likely to be relevant in all markets and at all times.
Flexibility: Supply and demand zones can be identified using a variety of methods, and traders can choose the method that best suits their trading style.
Backtesting: Supply and demand zones can be backtested to assess their effectiveness over time.
Cons
Subjectivity: Identifying supply and demand zones can be subjective, as there is no single, definitive way to do it.
False signals: Supply and demand zones are not always reliable, and traders can get false signals.
Skill level: Supply and demand zones require a certain level of skill to use effectively.
Market volatility: Supply and demand zones may not be as effective in highly volatile markets.
Psychological factors: Traders may make emotional decisions based on supply and demand zones, which can lead to mistakes.
Overall, supply and demand zones can be a valuable tool for traders, but they should not be considered a foolproof method.
Trading Strategies
Supply and demand zone trading is all about identifying areas on a price chart where the price has previously made a significant move either up or down. These zones can indicate potential buy or sell opportunities.
Identifying Zones: Supply zones are where sellers overcame buyers, pushing the price down. Look for a rapid drop in price from a specific area. Demand zones are the opposite, where buyers overcame sellers, causing the price to shoot up. Spot these by finding a sharp price increase.
Trading Strategies:
Buy at Demand Zones: When the price returns to a demand zone and shows signs of bouncing up, it could be a good buying opportunity. The idea is that buyers will come in strong again and push the price up.
Sell at Supply Zones: If the price approaches a supply zone and starts to fall, it might be a good time to sell or short-sell. The expectation is that sellers will dominate and drive the price down again.
Confirmation and Entry: Don’t jump in as soon as the price hits the zone. Wait for confirmation, like a candlestick pattern or an indicator signal, to suggest the price is moving in your anticipated direction.
Stop Loss and Take Profit: Set a stop loss just outside the zone to minimize risk if the price breaks through. Your take profit can be set near the next supply or demand zone.
Risk Management: Only risk a small percentage of your trading capital on any single trade to protect yourself from significant losses.
Remember, these zones aren’t exact price points but rather areas. Market conditions can change, so always be prepared to adjust your strategy.
Summary
In the realm of financial markets, the strategy of supply and demand trading has emerged as a pivotal approach, harnessing the fundamental economic principles where an excess of supply leads to price declines, and a surplus of demand prompts price increases. This strategy is not confined to a single asset class but spans across stocks, commodities, and forex, showcasing its versatility.
Frequently Asked Questions
How do you find Supply and Demand Zones?
Supply and Demand Zones can be identified by analyzing price charts for areas where significant price movements have occurred, indicating strong buying or selling interest. Key indicators include swing points, price reversal areas, consolidation zones, and high trading volume at reversal points. The freshness of a zone and analysis across multiple time frames can also enhance the reliability of these zones.
How do Supply and Demand affect FX currency pairs?
Supply and Demand factors can significantly impact the value of currency pairs in the forex market. Changes in demand and supply can affect currency rates, influenced by economic forces, central bank interventions, and the actions of large financial institutions.
How do Supply and Demand Zones differ from Support and Resistance?
While both concepts aim to identify potential reversal areas, Supply and Demand Zones are defined by broader price areas where significant buying or selling has occurred, leading to price movements. In contrast, Support and Resistance levels are specific price points that halt price movements due to historical trading activity.
Can Supply and Demand Trading be profitable?
Yes, Supply and Demand Trading can be very profitable if executed correctly. It requires a deep understanding of market dynamics, the ability to accurately identify supply and demand zones, and disciplined risk management. However, like any trading strategy, it comes with inherent risks, and there is always the potential for loss