In this comprehensive guide, we delve into the intricacies of the inverse head and shoulders pattern. The article will provide a detailed explanation of the pattern, its key components, and how it is formed. We will also discuss how to identify this pattern and use it to make informed trading decisions. Whether you’re a seasoned trader or a beginner, this guide aims to enhance your understanding of the inverse head and shoulders pattern and its application in trading strategies.
What is an inverse head and shoulders pattern?
An inverse head and shoulders pattern is a technical analysis chart pattern that signals a potential trend reversal from a downtrend to an uptrend.
Both “Inverse” and “reverse” head and shoulders patterns are the same.
“Head and Shoulder Bottom” is also the same thing.
In simpler words, an inverse head and shoulders pattern is like a chart clue in technical analysis that suggests a shift might happen from a falling trend to a rising trend. The pattern is characterized by three consecutive troughs, with:
The middle trough: Known as the head, being the lowest.
The other two troughs: Known as the shoulders, forming higher lows.
Hence its name, the pattern resembles a head with two shoulders.
What it indicates: Stock’s price might be moving up
An inverse head and shoulders pattern is like a signal in the stock market, telling us that a stock’s price might be getting ready to move up after a period of going down. When you spot this pattern, it’s often seen as a good sign that the downtrend is about to turn around and prices could start climbing.
It’s like a hint for traders to consider getting in on the action, expecting the prices to go up.
Key Components of the chart pattern
The reverse head and shoulders pattern is formed when the price of an asset makes three distinct troughs, with the second trough being the lowest (forming the “head”) and the other two troughs being slightly higher (forming the “shoulders”).
Below’s our breakdown.
1. Lead in downtrend
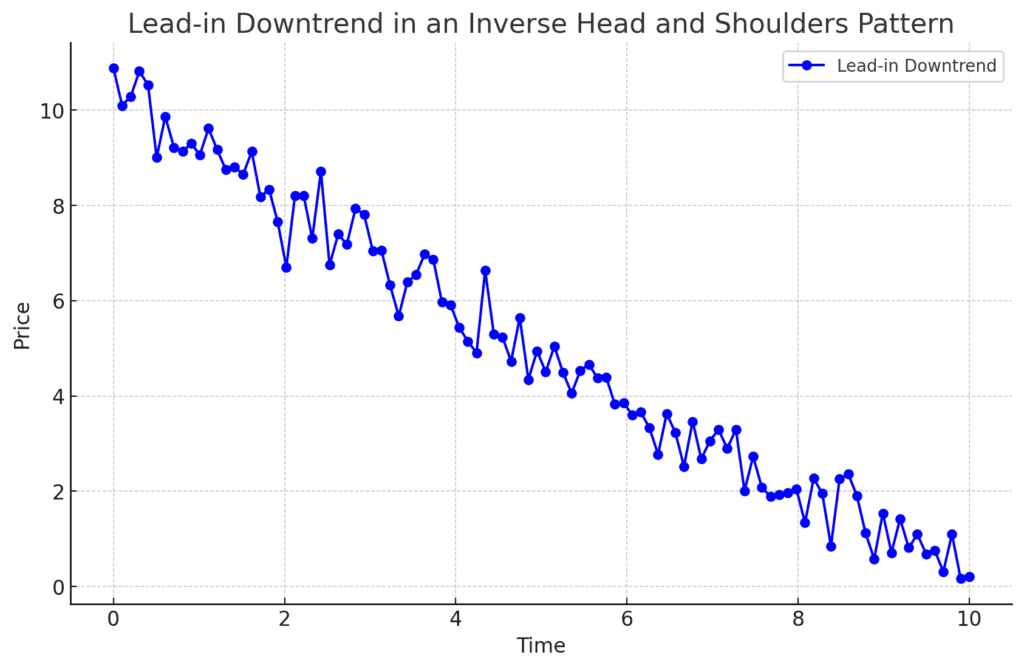
The pattern is preceded by a clear downward trend in the price of the asset. This downtrend establishes the context for the potential reversal.
2. Formation of the inverse
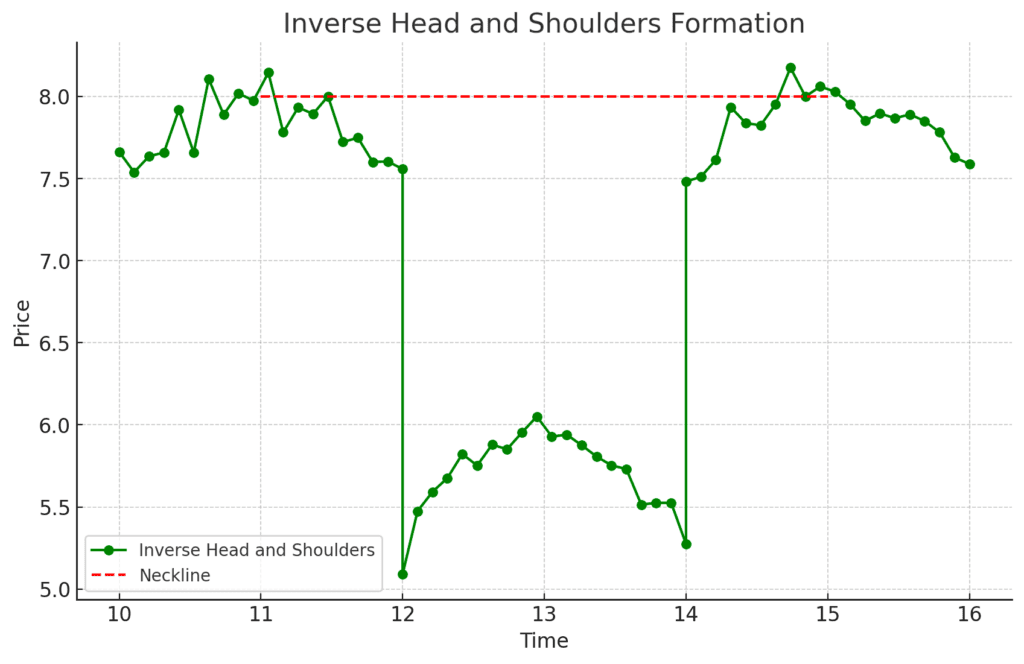
Left Shoulder: The first trough, or the left shoulder, is formed when the price reaches a low point and then rallies back up. This rally is typically shallower than the rallies that follow.
Head: The second trough is the deepest of the three troughs and forms the head of the pattern. It represents a temporary setback in the potential reversal.
Right Shoulder: The third trough is slightly higher than the head and forms the right shoulder. It indicates a strengthening of buying pressure and suggests that the downtrend may be losing steam.
3. Neckline resistance
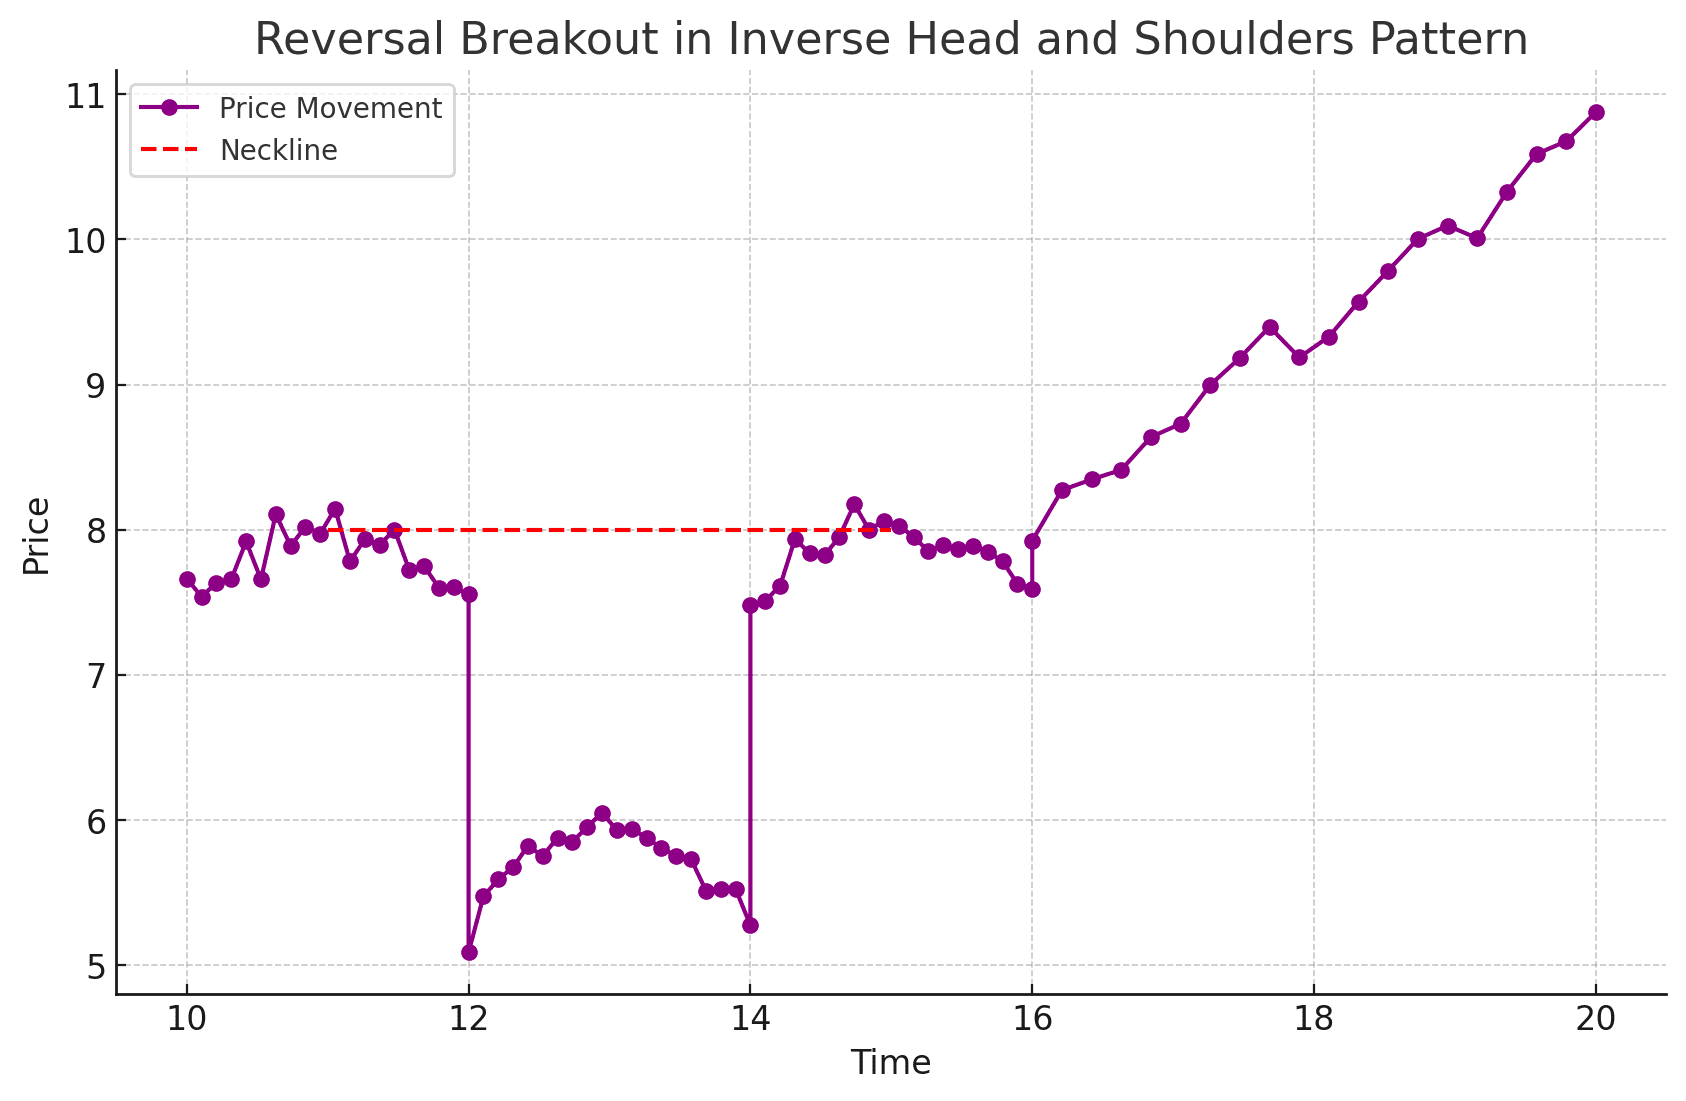
The neckline is a horizontal line drawn connecting the peaks of the left and right shoulders. It acts as a resistance level, and a breakout above the neckline is considered a bullish signal.
The completion of the inverse head and shoulders pattern occurs when the price successfully breaks above the neckline.
This breakout indicates that the downtrend has likely ended and a bullish trend may be underway.
How to trade using this method
Identify the inverse head and shoulders pattern on a price chart, signaling a potential bullish reversal. Then, enter a long position when the price breaks above the pattern’s neckline, setting a stop-loss to manage risk and aiming for a target based on the pattern’s projected move.
1. Identify the Pattern
The first step is to identify the pattern on a price chart. Look for three troughs with the second trough being the lowest.
The neckline is a horizontal line connecting the peaks of the left and right shoulders.
2. Wait for a Breakout Above the Neckline
Once the pattern has formed, wait for a breakout above the neckline.
This breakout is considered a bullish signal and indicates that the downtrend may be ending.
3. Enter a Long Position
Once the price breaks above the neckline, enter a long position.
Place a stop-loss order below the lowest point of the right shoulder.
4. Set a Profit Target
The profit target is typically set at the height of the head above the neckline.
You can also use other technical indicators to set profit targets.
Real Example: Microsoft (MSFT) in 2023
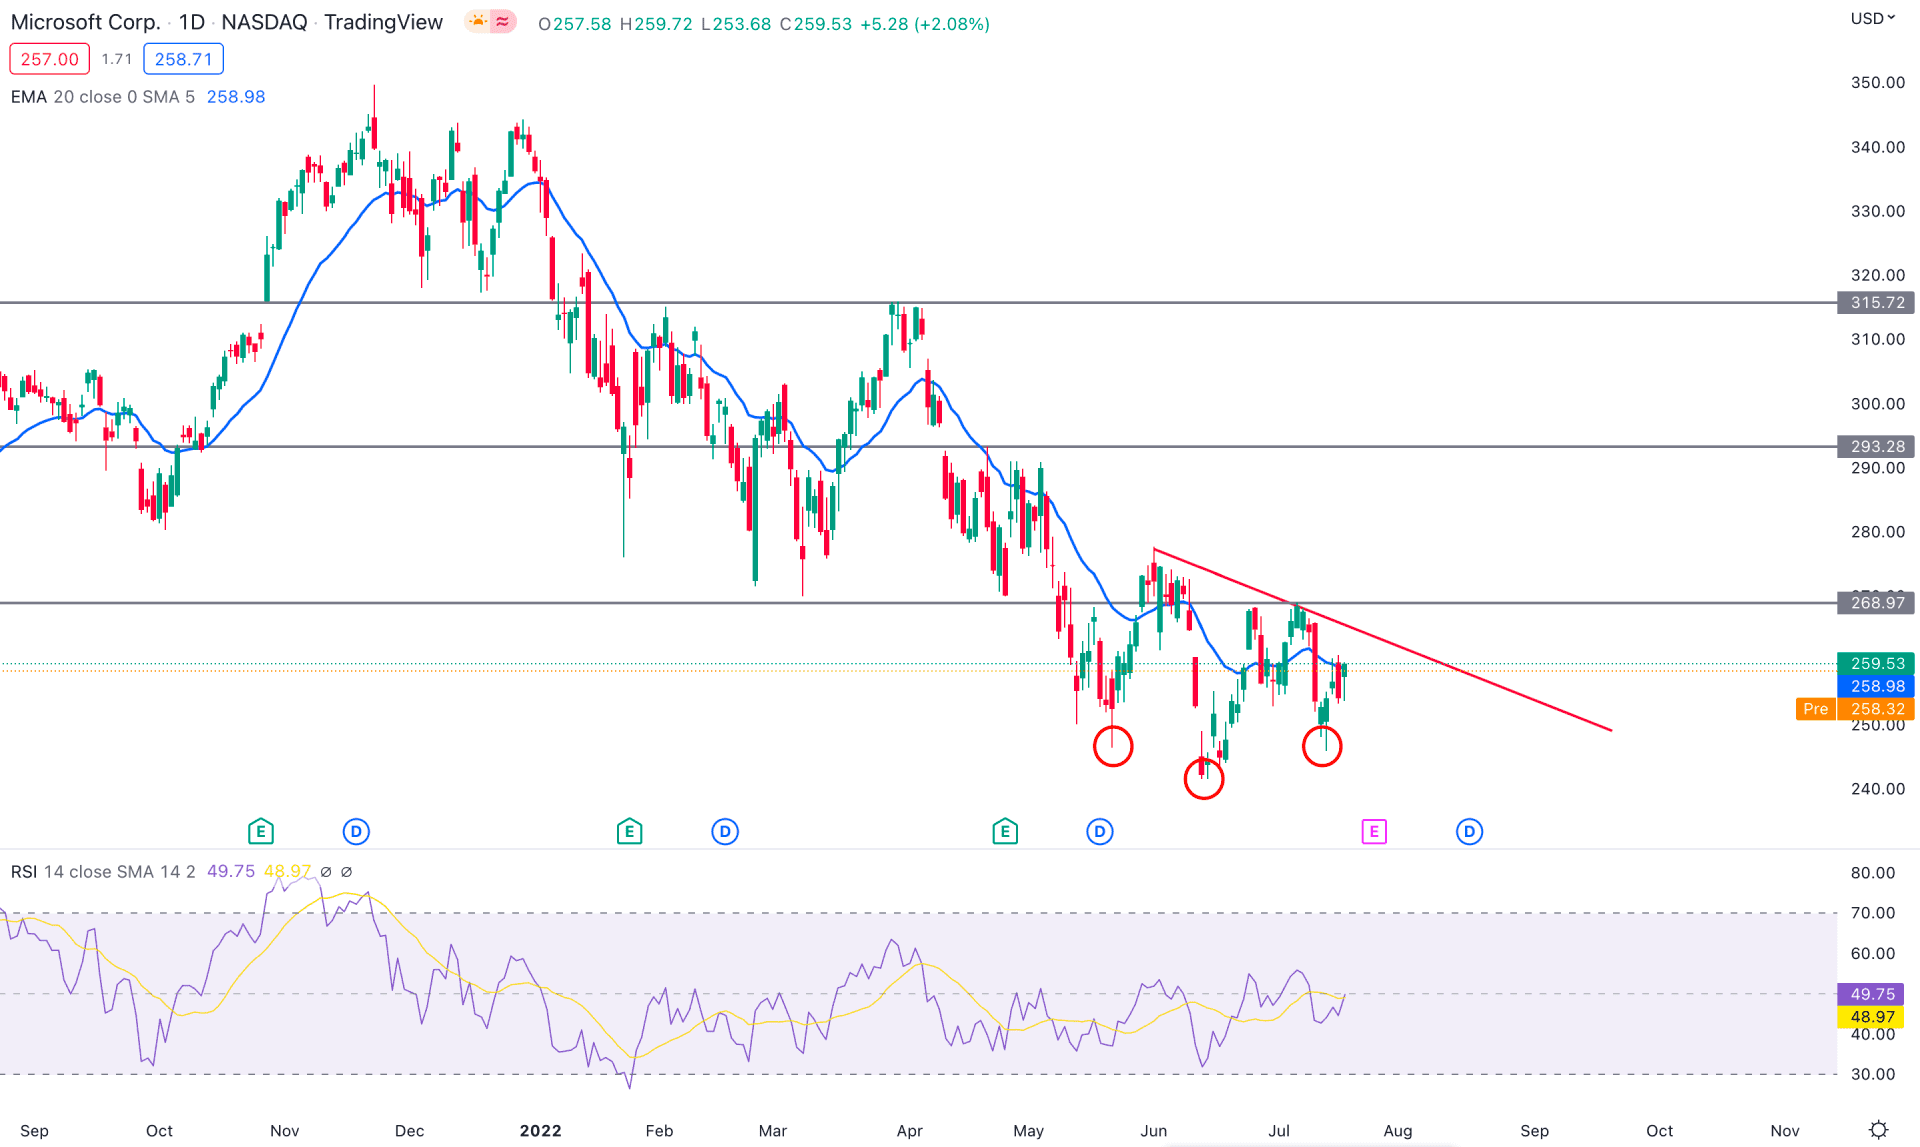
Source for the picture: FX-List. February 21, 2023 – April 11, 2023.
Theory will only take you so far. Let’s have a look at an example of a real inverse head and shoulders pattern, with real data. We’ll look at MSFT (Microsoft in 2023):
1. Description
Microsoft’s stock price was in a downward trend from January to February 2023.
On February 21, 2023, the price made a low of $115.22, forming the left shoulder of the inverse head and shoulders pattern.
The price then rallied to $134.02 on March 31, 2023, forming the head of the pattern.
After a brief pullback, the price rallied again to $132.34 on April 11, 2023, forming the right shoulder of the pattern.
The neckline was drawn connecting the peaks of the left and right shoulders.
2. Breakout
On April 11, 2023, the price broke above the neckline, signaling a potential bullish reversal. The breakout was accompanied by strong volume, which further confirmed the bullish signal.
3. Price Action
After the breakout, Microsoft’s stock price continued to rise, reaching a high of $142.90 on May 3, 2023. This example demonstrates how the inverse head and shoulders pattern can be used to identify potential trend reversals. By following the steps outlined in the previous section, traders can increase their chances of success when trading this pattern.
Frequently Asked Questions
1. What are some of the limitations?
The pattern is not always a reliable indicator of a trend reversal.
The pattern can be faked out by false breakouts.
The pattern is more likely to be reliable in strong trending markets.
2. How can I improve my chances of success?
Use other technical indicators to confirm the pattern.
Use a wider neckline to filter out weak patterns.
Wait for a strong breakout above the neckline before entering a trade.
Use a stop-loss order to limit your losses.
3. What negates an inverse head and shoulders pattern?
There are a few things that can negate an inverse head and shoulders pattern:
A failed breakout: If the price fails to break above the neckline, it could indicate that the downtrend is not over and that the pattern is not valid.
Weak volume: If the breakout is not accompanied by strong volume, it could indicate that the breakout is not real and that the pattern is not likely to be followed by a trend reversal.
Further price decline: If the price continues to decline after the formation of the pattern, it could indicate that the downtrend is still in effect and that the pattern is not valid.
False breakout: A false breakout occurs when the price breaks above the neckline but then quickly falls back below it. This could indicate that the downtrend is still in effect and that the pattern is not valid.
Other technical indicators: Other technical indicators, such as the moving average convergence divergence (MACD) and relative strength index (RSI), can also help to confirm or negate an inverse head and shoulders pattern.
4. What is the difference between an inverse and a regular pattern?
| Feature | Regular pattern | Inverse pattern |
|---|---|---|
| Directional bias | Bearish | Bullish |
| Trend in which it is formed | Uptrend | Downtrend |
| Indication | Potential trend reversal from bullish to bearish | Potential trend reversal from bearish to bullish |
| Location of troughs | Middle trough is the lowest | Middle trough is the highest |
| Neckline | Connects peaks of left and right shoulders | Connects troughs of left and right shoulders |
The other key differences between the two patterns are:
The location of the troughs: In the regular head and shoulders pattern, the middle trough (the head) is the lowest of the three troughs. In the inverse head and shoulders pattern, the middle trough (the head) is the highest of the three troughs.
The neckline: In the regular head and shoulders pattern, the neckline is a horizontal line that connects the peaks of the left and right shoulders. In the inverse head and shoulders pattern, the neckline is a horizontal line that connects the troughs of the left and right shoulders.
Conclusion
In conclusion, the inverse head and shoulders pattern is a powerful tool in technical analysis, offering traders a potential signal for a trend reversal from a downtrend to an uptrend. This guide has provided a comprehensive understanding of the pattern, its formation, and its application in trading strategies, further illustrated with a real-world example.
However, it’s crucial to remember that while this pattern can be a useful indicator, it is not infallible and should be used in conjunction with other technical indicators to confirm its validity. As we continue to navigate the complex world of stock trading, the inverse head and shoulders pattern remains a valuable asset in our analytical toolkit