The Wyckoff distribution is a price pattern in technical analysis that suggests a potential downtrend in the price of an asset. Developed by Richard D. Wyckoff, it is the opposite of the Wyckoff accumulation pattern, which suggests a potential uptrend.
The Basics: Wyckoff Distribution
The Wyckoff Method is a key approach for traders to understand how markets work and how investor behavior affects them.
It’s especially useful for getting to grips with the Wyckoff Distribution pattern and its effect on trading.
Understanding Supply and Demand: This method is all about getting how supply and demand impact market prices. Knowing these dynamics is crucial for traders.
Market Manipulation Insight: Wyckoff pointed out that big players in the market, like large institutions, often manipulate prices to benefit their trading positions. Spotting these tactics can be key for traders to foresee major changes or drops in prices.
Watching the Big Players: The method stresses the importance of watching what the big institutional investors do. These “smart money” players have a lot of sway over where the market goes. Keeping an eye on their actions offers clues about future price movements.
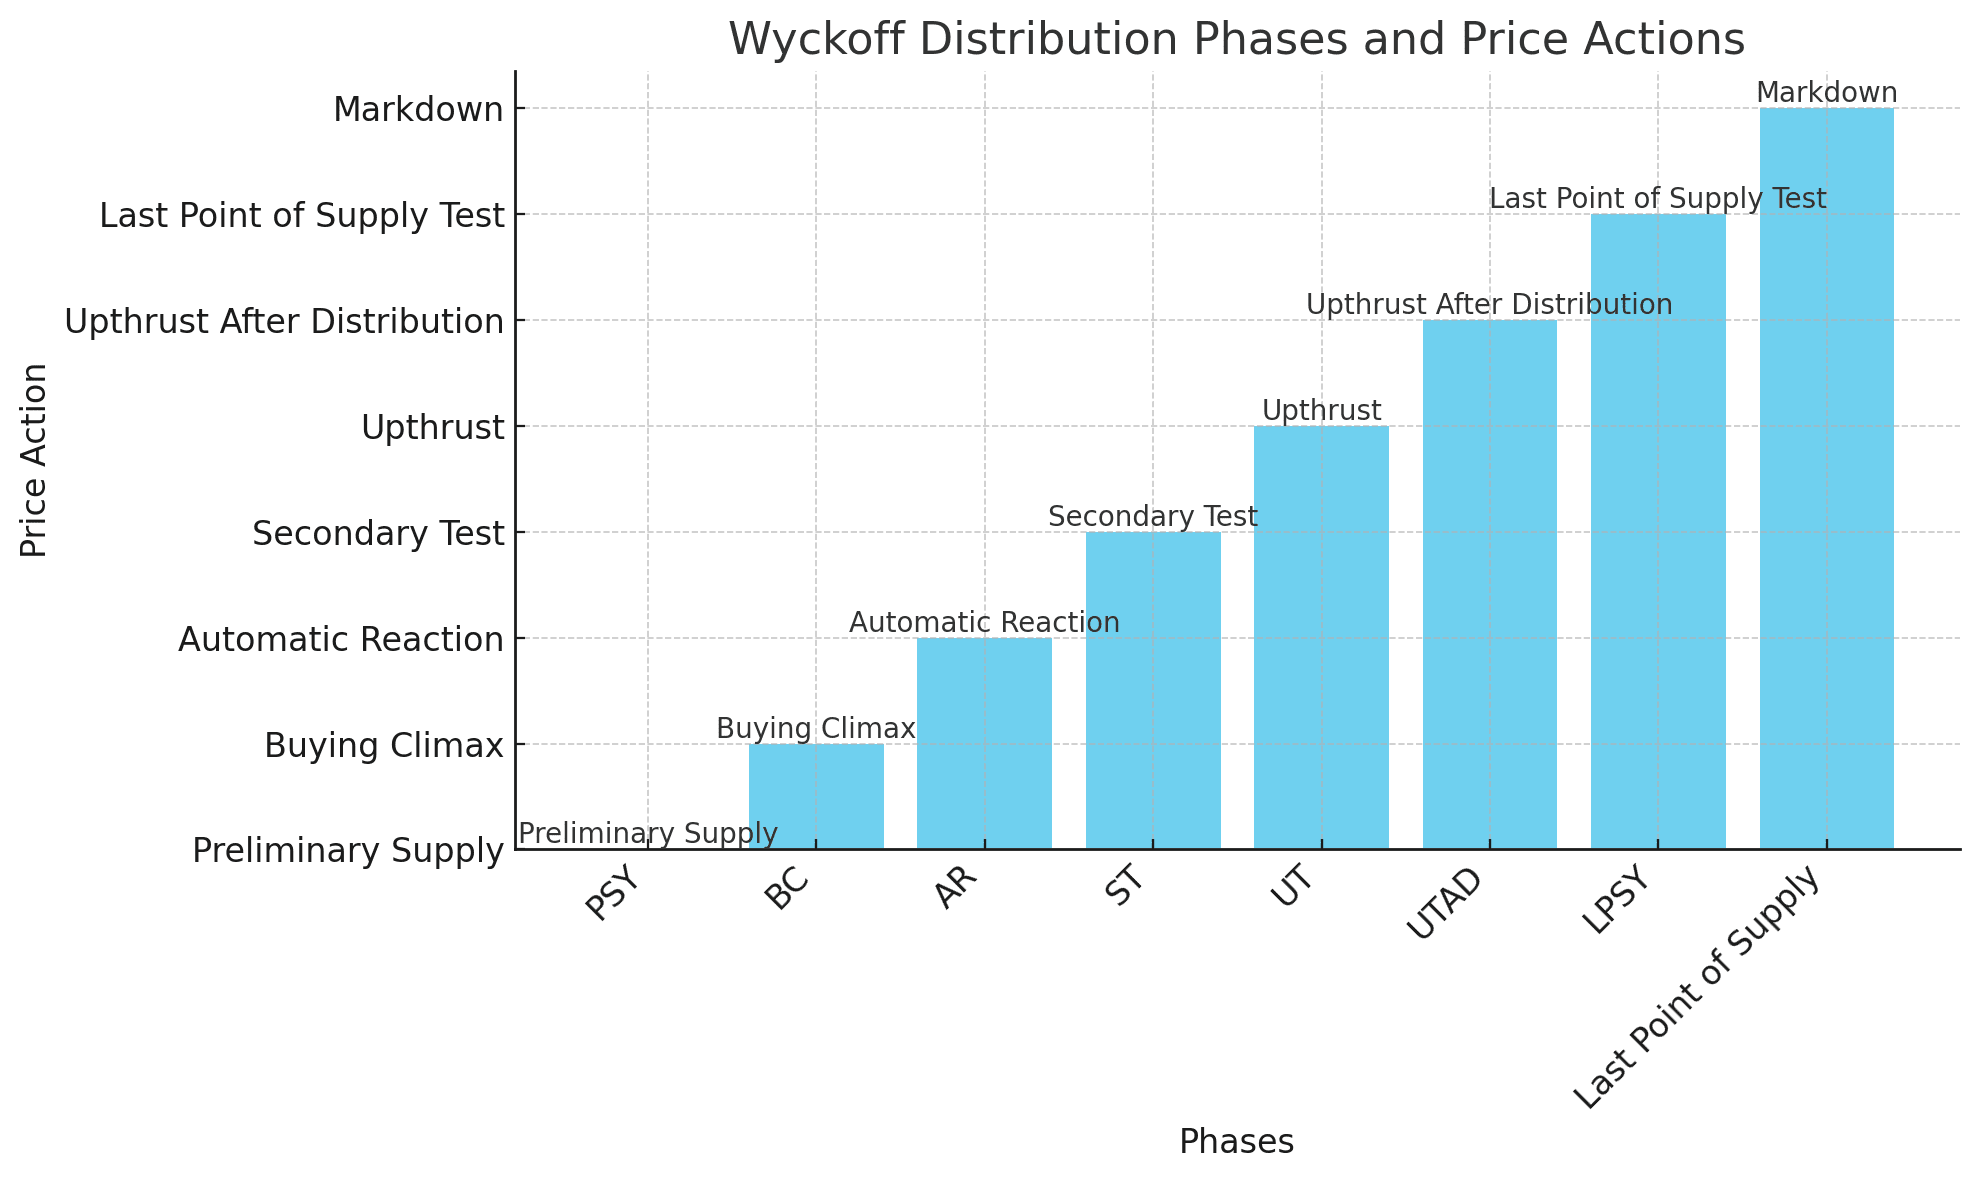
The Pattern
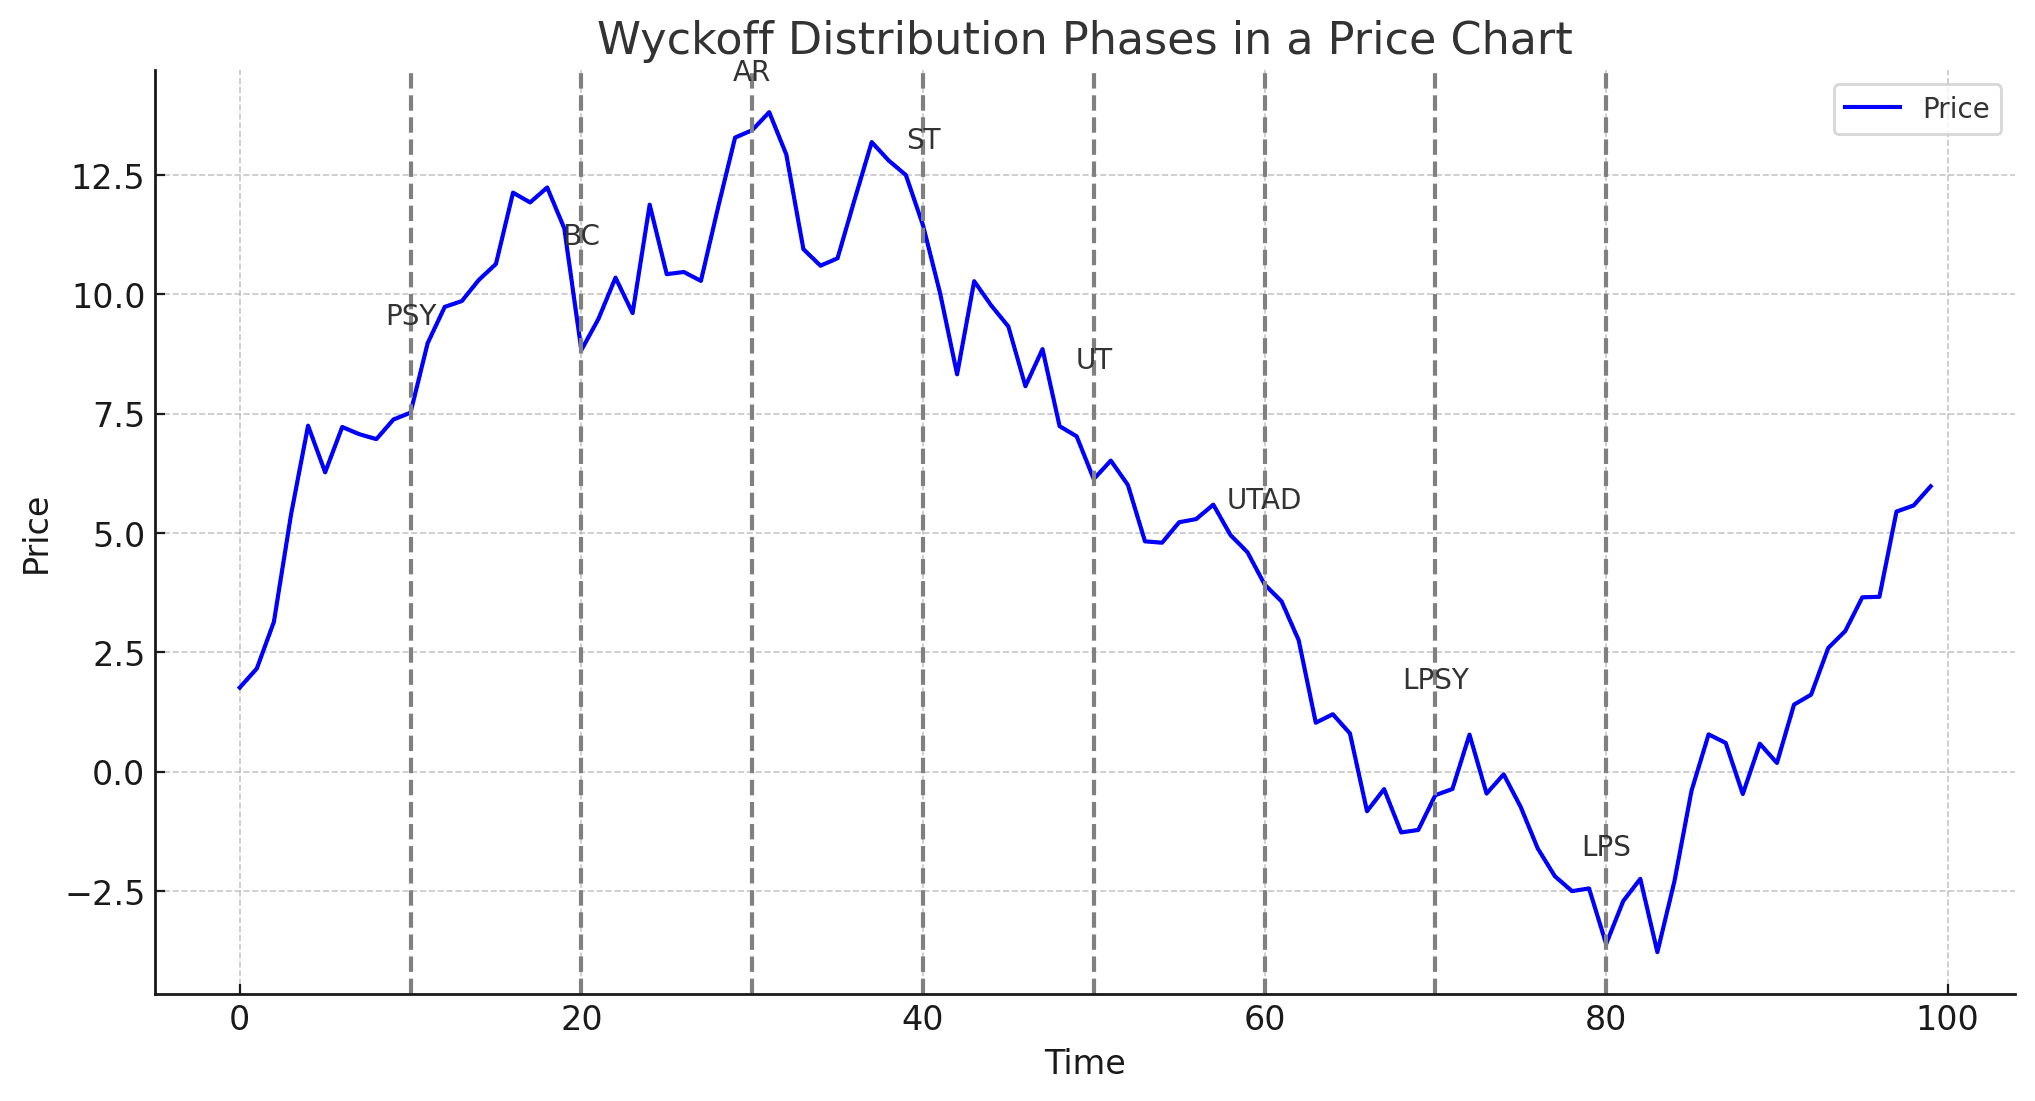
The Wyckoff Distribution is a technical analysis tool that helps traders spot potential downtrends in an asset’s price. To make it easier, think of it as a detective story, where you’re piecing together clues (price action and volume) to predict the market’s next move.
Phase 1: Growth slows down → Stops
The Tip-Off: The uptrend you’ve been enjoying starts to lose steam. The price makes lower highs (think: bunny hills instead of Mount Everest) and lower lows (like descending into a valley).
Volume Woes: The excitement fades. Trading volume, which used to be like a cheering crowd, starts to fall, hinting that big players are losing interest.
Phase 2: The buying rush is on
Price Plunges: The price starts dropping more decisively, like a skier gaining speed.
Selling Climaxes: There might be sudden, sharp price drops called “selling climaxes,” where everyone’s rushing to offload their shares, creating high volume spikes.
Testing, Testing: The price might bounce back briefly, testing the previous support levels like a yo-yo. This is a trick to lure in unsuspecting buyers before the real dive.
Phase 3: The decline continues
Gravity Takes Hold: The downtrend picks up pace. The price keeps making lower lows, like a ball rolling down a hill.
Volume Stays High: The high volume persists, indicating ongoing selling pressure from big players.
Traders can use the Wyckoff distribution pattern to identify potential selling opportunities. They can also use it to confirm a bearish bias.
Important note: The Wyckoff distribution pattern is not a foolproof indicator.
It should be used in conjunction with other technical analysis tools and should not be used as the sole basis for making trading decisions.
Use it to Scan the Market
The Wyckoff Distribution pattern can be used effectively in scanning the market for potential shorting or selling opportunities by focusing on identifying stocks exhibiting the signature characteristics of the distribution process. Here’s how:
Filter based on the Wyckoff Distribution process
Phase A:
Identify stocks with declining trading volume despite being in an uptrend.
Look for stocks making lower highs and lower lows, indicating weakening momentum.
Phase B:
Scan for stocks experiencing sudden price drops (selling climaxes) on high volume.
Look for stocks retesting previous support levels without confirming a breakout, suggesting a potential false positive.
Phase C:
Scan for stocks consistently making lower lows on high volume, confirming the downtrend.
Look for stocks underperforming the broader market, indicating a possible shift in sentiment.
Go further with filtered scanning
Volume & Price Convergence: Combine volume analysis with price action. Look for situations where volume increases as the price falls, suggesting strong selling pressure.
Relative Strength Index (RSI): Monitor the RSI indicator. Ideally, look for values above 70 in Phase A or B, potentially indicating an overbought condition followed by a reversal.
Moving Average Convergence Divergence (MACD): Track the MACD for bearish crossovers, signaling a shift in momentum from bullish to bearish.
Pros & Cons: Wyckoff Distribution Pattern
The Wyckoff Distribution pattern is a valuable tool for traders who seek to understand market psychology and anticipate potential downtrends.
However: It’s essential to use it cautiously, in conjunction with other analysis techniques, and to manage risk appropriately.
1. Pros
Anticipates Downtrends: Can signal potential downtrends before they fully unfold, allowing traders to adjust positions accordingly.
Provides Insights into Market Psychology: Reveals the actions of large institutional investors (Composite Man), offering a deeper understanding of market forces.
Multiple Confirmation Points: Offers multiple phases and events (e.g., selling climaxes, upthrusts) that can strengthen the validity of the pattern.
Can Be Used for Scanning and Shorting: Applicable for scanning markets to identify potential shorting or selling opportunities.
Complements Other Analysis Techniques: Works well in conjunction with other technical indicators and fundamental analysis.
2. Cons
Subjective Interpretation: Pattern recognition and interpretation can be subjective, leading to variations in analysis.
False Signals Possible: False breakouts or misleading signals can occur, requiring confirmation from other indicators.
Requires Experience: Effective application demands practice and experience in identifying and interpreting Wyckoff patterns.
Not Always Reliable: Like any technical analysis tool, it’s not foolproof and can sometimes fail to predict market movements accurately.
Can Be Time-Consuming: Identifying and analyzing Wyckoff patterns can be time-consuming, especially for those new to the method.
Risk Management & Trading Strategies
Market sentiment can shift quickly, so manage your risk diligently and adapt your strategies as needed. Let’s see a few risk management methods. Then, we’ll look at trading strategies.
Risk Management
Use Stop-Loss Orders: Always place stop-loss orders slightly above the breakout point or key support level to limit potential losses if the trade turns against you.
Position Sizing: Maintain proper position sizing, risking only a small percentage of your capital on any single trade.
Profit Targets: Set realistic profit targets based on technical levels or risk-reward ratios, avoid chasing falling knives.
Monitor the Trade: Actively monitor your trades and adjust stop-loss orders or exit positions if the market sentiment changes or the pattern breaks down.
Avoid Overtrading: Resist the temptation to overtrade or chase every potential shorting opportunity. Stick to your trading plan and be patient.
Shorting Strategies
Short on Spring & Break: If you see a deceptive price spike above support followed by a sharp breakdown on high volume, consider a shorting opportunity with tight stop-loss orders.
Trend Confirmation Shorts: Wait for the downtrend to solidify in Phase C before initiating short positions for potentially larger profit potential.
Sector Correlation: If the stock’s sector is also showing bearish momentum, it can strengthen the case for shorting.
Go Deeper — The Composite Man
In the Wyckoff method of understanding market dynamics, the Composite Man isn’t actually a single person. It’s a conceptual figure representing the combined actions of large institutional investors and market operators who hold significant power.
Think of it as a collective entity, like a team of chess grandmasters pulling the strings behind the scenes.
Master Puppeteer: The Composite Man is the invisible hand controlling the market, accumulating stocks at low prices and strategically distributing them to maximize profits. Imagine him as a puppet master pulling the strings behind the scenes, making the stock market dance to his tune.
Crafty Strategist: He’s not just a brute force pusher. He’s a great planner who manipulates supply and demand through clever tactics like creating false breakouts and using selling climaxes to shake out weak-handed investors. Think of him as a poker player with all the aces up his sleeve, always a few steps ahead of the game.
Smart Money Magnet: By understanding the Composite Man’s moves, traders can learn to follow the “smart money,” identifying opportunities to buy low and sell high. It’s like cracking the market’s secret code and joining the VIP section, gaining access to valuable insights and making informed trading decisions.
Not a Guaranteed Blueprint: Remember, the Composite Man is a concept, not a guaranteed path to success. The market is complex and unpredictable, and even the smartest strategies can sometimes fail. However, by understanding his game and recognizing his footprints in the charts, you can become a more informed trader, navigating the market with greater awareness and confidence.
Conclusion
Here are the key takeaways from our guide:
The Wyckoff Distribution is not a guaranteed prediction tool. Combine it with other technical and fundamental analysis for informed decisions.
Market sentiment can shift quickly. Manage your risk diligently and adapt your strategies as needed.
Practice and experience are key to refining your Wyckoff analysis and trading skills.
By mastering these trading strategies and implementing sound risk management practices, you can leverage the Wyckoff Distribution pattern to navigate downtrends and potentially improve your trading outcomes.
Frequently Asked Questions
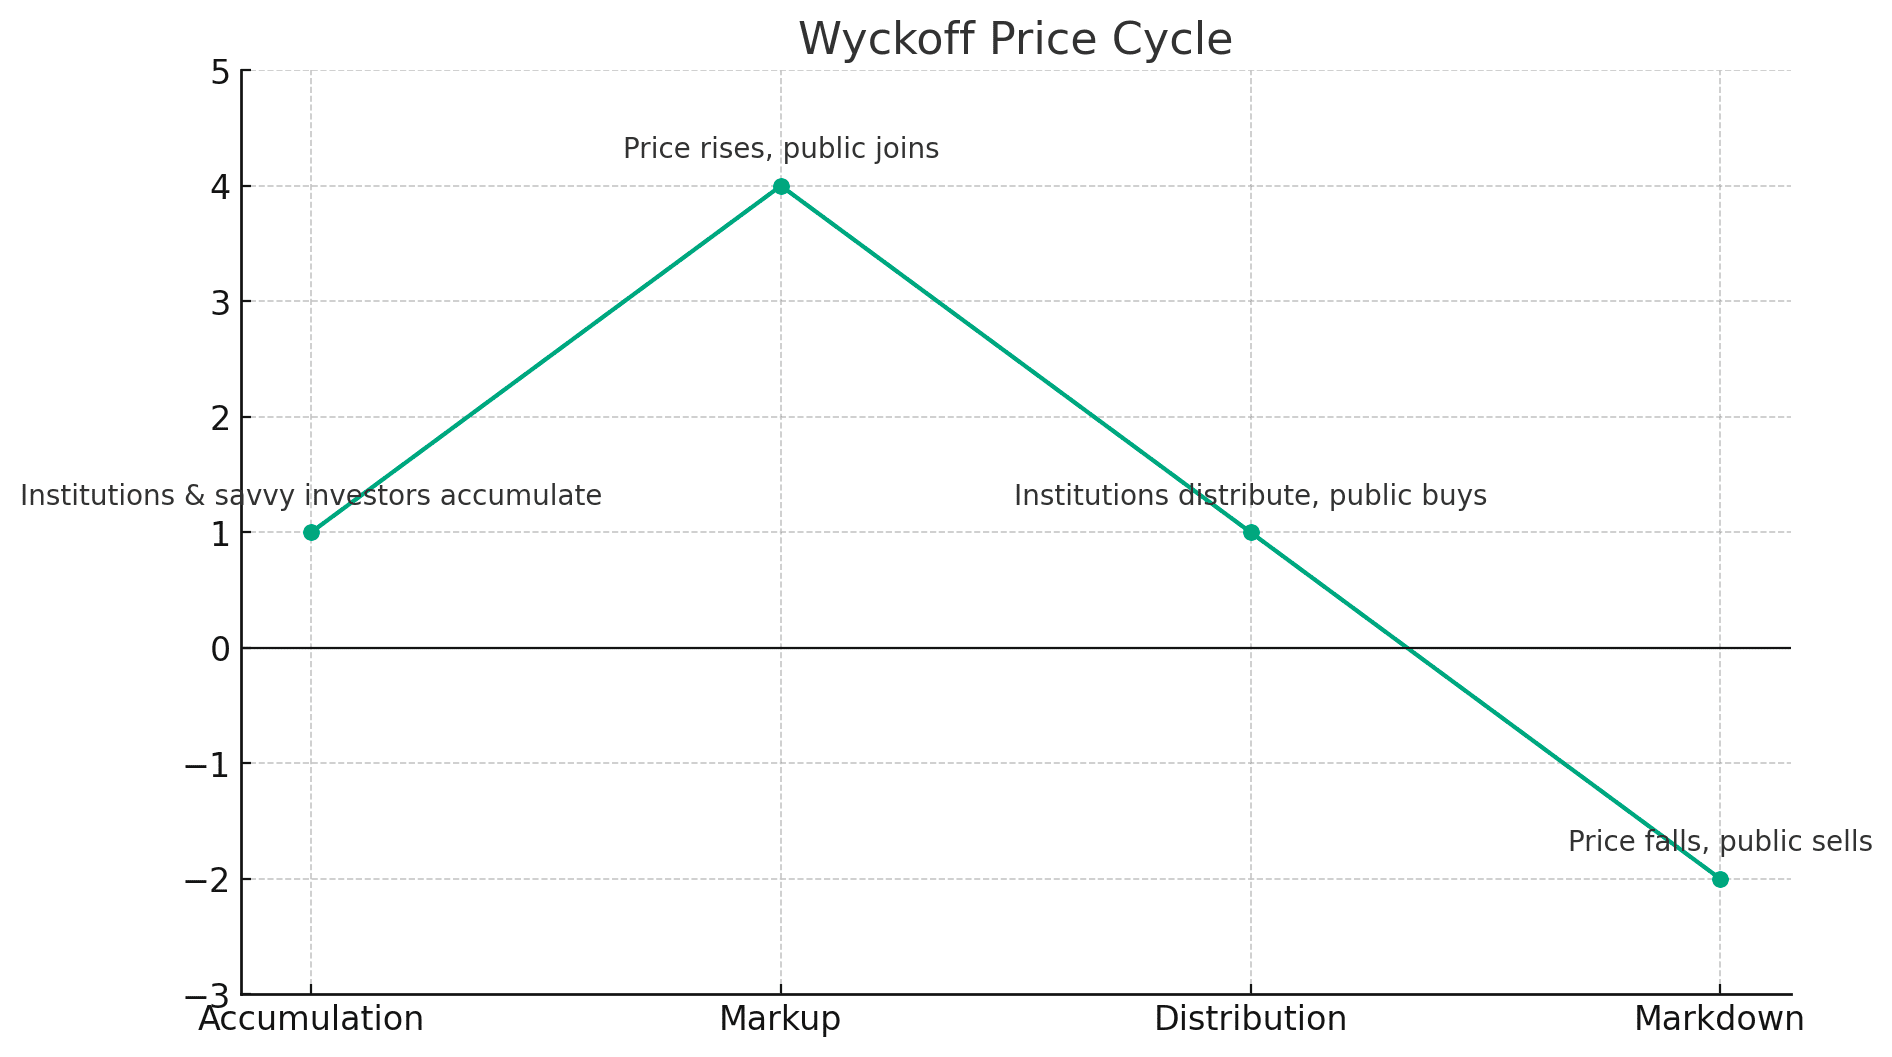
What is the Wyckoff Distribution method?
The Wyckoff Distribution method is a technical analysis approach that helps traders navigate financial markets based on the relationship between supply and demand. It outlines key elements in price trend development marked by periods of accumulation, markup, distribution, and markdown
What are some common misconceptions about the Wyckoff Distribution method?
A common misconception about the Wyckoff Distribution method is that it is a prediction tool. However, it is not designed to predict market movements but rather to analyze them. Other factors that can influence the accuracy of the Wyckoff analysis include sudden developments, market manipulation, relatively low volumes, timeframe signals, data quality, and high volatility
What are some strategies to trade the Wyckoff Distribution?
Traders can use range-bound strategies, paying attention to indicators like the 200 EMA. It’s also important to identify the start of phase B and determine the whereabouts of the lower boundary of the trading range
What are some limitations of the Wyckoff Distribution method?
The Wyckoff Distribution method may not be suitable in highly volatile markets, news-driven stock markets, situations with poor technical analysis skill levels, or when there are too few data points for observation