In the tumultuous seas of financial markets, traders are always on the lookout for reliable signals to navigate the ebb and flow of asset prices. Among the myriad of technical analysis tools, the hammer candlestick pattern stands out as a potential lifeline for those caught in the undertow of a downtrend. This unassuming yet powerful pattern, resembling a hammer, can be a beacon of hope for traders seeking a reversal of fortune.
What is a Hammer Candlestick?
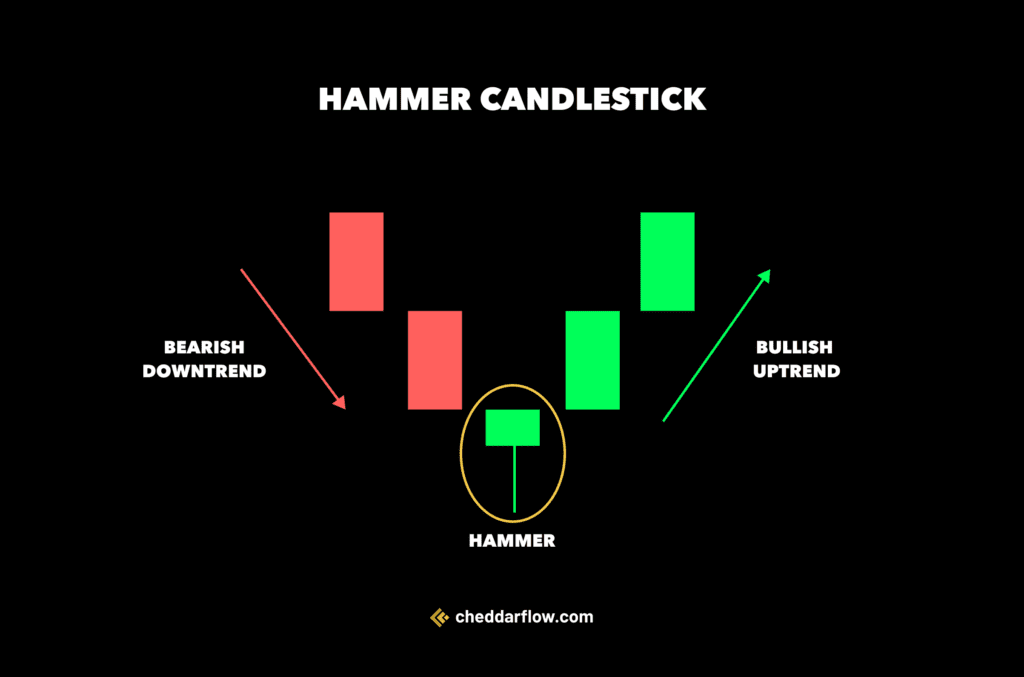
A hammer candlestick is a technical analysis pattern used in financial markets to signal a potential reversal in a downtrend. It resembles a hammer in shape, with a long lower wick extending down from the body and a small upper wick or no upper wick at all.
1. How it is formed
- Downtrend: The hammer appears at the end of a downtrend, suggesting a possible shift in momentum.
- Long Lower Wick: The wick extends significantly below the body, ideally at least twice the size of the body. This signifies selling pressure that was eventually overcome by buyers.
- Small Body: The body represents the difference between the opening and closing prices. A small body indicates indecision between buyers and sellers.
- Close Near Open: The price ideally closes near or at its opening price, showing buyers were able to push the price back up after the initial drop.
2. When it occcurs
Hammer candlesticks typically occur after a period of price decline.
This means you’ll see them at the bottom of a downtrend on a price chart. Their presence suggests that sellers initially pushed the price down, but by the close of the trading period, buyers stepped in and reversed the course, at least partially.
3. What it indicates
A hammer candlestick indicates a potential bullish reversal in the price trend. → it suggests that a price that has been going down (downtrend) might be reaching its bottom and starting to go up (uptrend).
The hammer’s shape reflects this potential shift:
- The long lower wick shows a strong selling pressure that drove the price down significantly.
- However, the small body and the closing price near the opening price indicate that buyers were able to push back against the sellers and recover some of the lost ground.
This tug-of-war between sellers and buyers creates a chance that the downtrend might be losing momentum and a new uptrend could begin. However, it’s important to remember that the hammer candlestick is just a signal, not a guaranteed prediction.
Example of a Hammer Candlestick
A real-life example of a hammer candlestick formation can be seen in the stock of Apple Inc. (AAPL).
Let’s say on a specific trading day, Apple’s stock opened at $150, dipped to a low of $145 during the session, but then rebounded and closed near its opening price at $149.
This price action creates a candlestick with a small real body and a long lower shadow, resembling a hammer.
This is typically considered a bullish signal, suggesting that despite selling pressure during the day, buyers were able to push the price back up close to the opening level, indicating potential for a reversal if it occurred in a downtrend.
Keep in mind, it’s important to consider other factors and signals in the market for confirmation.
Hammer Candlestick vs Doji
| Difference | Hammer Candlestick | Doji |
|---|---|---|
| Body | Small but definite | Near-zero |
| Lower Shadow | Long, extends significantly below body | Can have upper and lower shadows of similar lengths |
| Upper Shadow | Short or minimal | Can have upper and lower shadows of similar lengths |
| Trend Context | Downtrend, suggests potential bullish reversal | Any trend, indicates indecision |
Doji:
- Shape: A Doji has a very small real body, almost like a flat line, indicating the opening and closing prices are very close. It has both an upper and lower shadow.
- Signal: A Doji signifies indecision in the market. The price opened, reached higher and lower points, but closed at nearly the same price it started. It can precede a trend reversal or continuation, depending on the context.
Hammer Candlestick:
- Shape: Resembles a hammer with a short or minimal upper shadow, a small body, and a long lower shadow extending significantly below the body.
- Signal: A hammer suggests a potential bullish reversal after a downtrend. The long lower wick shows selling pressure that was pushed back by buyers. The small body and close near the open indicate indecision but with buyers gaining some control.
Pros & Cons: Hammer Candlestick
By understanding both the pros and cons of hammer candlesticks, you can use them as a helpful tool in your technical analysis toolbox, but remember to prioritize confirmation and a broader market context before making trading decisions.
1. Pros
- Versatility: Hammer candlesticks can be used across various financial markets (stocks, forex, crypto) and on different timeframes (daily, hourly, etc.).
- Potential Reversal Signal: They offer a visual cue for a potential shift in momentum from a downtrend to an uptrend.
- Confirmation Tool: When combined with other technical indicators, hammer candlesticks can strengthen trading decisions.
- Simplicity: The hammer pattern is easy to identify on a price chart due to its distinct shape.
2. Cons
- Not Guaranteed: A hammer candlestick doesn’t guarantee a bullish reversal. The downtrend might continue.
- False Signals: Other factors can mimic the hammer shape, leading to misleading reversal signals.
- Confirmation Needed: Always use the hammer in conjunction with other technical analysis tools for confirmation.
- Limited Information: The hammer only reflects price action within a single trading period, not the bigger picture.
Conclusion
In conclusion, the hammer candlestick pattern is a valuable addition to any trader’s toolbox, offering a visual cue for potential trend reversals in various financial markets. However, like any tool, it must be used with caution and in conjunction with other forms of analysis to increase the likelihood of making profitable trading decisions.
Frequently Asked Questions
What is hammer in candlestick
A hammer candlestick is a technical analysis pattern used in financial markets to signal a potential bullish reversal after a downtrend.
It visually resembles a hammer due to its distinct shape
Is the hammer bullish or bearish?
The hammer candlestick is a bullish pattern.
It appears during a downtrend and suggests a potential reversal towards an uptrend. The long lower wick indicates selling pressure that was overcome by buyers, and the small body with a close near the opening price shows some indecision but with buyers taking control.
While it’s a good sign for a potential bullish reversal, remember that it’s not a guaranteed prediction. It’s important to use it alongside other technical analysis tools for confirmation.
How reliable is a hammer candlestick?
| Traditional View | Somewhat reliable indicator for potential bullish reversal. Strengthens with confirmation from other technical indicators (longer wick, close near open, increased volume, support levels, uptrend indicators). |
| Critical View | May have low accuracy (around 50%), potentially no better than random chance. False signals can occur due to factors mimicking the hammer shape. |
| Overall | Use with caution. Not a guarantee for reversal. Confirmation and broader market analysis are crucial. |
Its reliability isn’t set in stone. It can be a useful indicator, but it’s more about the context in which it appears:
- Volume: A hammer with high trading volume can be more reliable as it shows significant buying interest.
- Market Condition: Works best after a downtrend. Its appearance in other conditions might not be as telling.
- Confirmation: It’s often wise to wait for confirmation in the next candlesticks or additional indicators before making a move, as false signals can occur.