The VIX Index is a key tool for gauging market sentiment and expected volatility. Here’s what you need to know:
- Created by CBOE in 1993, often called the “fear index”
- Measures expected S&P 500 volatility over next 30 days
- Higher VIX = more expected volatility and investor fear
- Calculated using S&P 500 options prices, not stock prices
VIX readings typically fall into these ranges:
| VIX Range | Market Sentiment |
|---|---|
| 0-15 | Low volatility, high optimism |
| 15-25 | Normal market conditions |
| 25-30 | Growing uncertainty |
| 30+ | High volatility, extreme fear |
Key uses:
- Gauge overall market sentiment
- Help time entry/exit points for trades
- Hedge against market downturns
But be careful:
- Can’t trade VIX directly – use futures, options, ETFs
- VIX products are complex and risky for beginners
- Don’t rely on VIX alone – use with other indicators
The VIX offers valuable insights, but should be one tool among many in your trading toolkit.
Related video from YouTube
Basics of the VIX Index
The VIX Index tracks expected S&P 500 volatility over the next 30 days. It’s based on S&P 500 index options prices, reflecting market expectations of future price swings.
How it’s calculated:
- Select S&P 500 options expiring in 23-37 days
- Use only at-the-money and out-of-the-money options
- Calculate each option’s contribution to total variance
- Interpolate variances to get a 30-day estimate
- Take the square root and multiply by 100 for the final VIX value
Key historical points:
- 1993: CBOE launches VIX based on S&P 100 options
- 2003: Switches to S&P 500 options for better accuracy
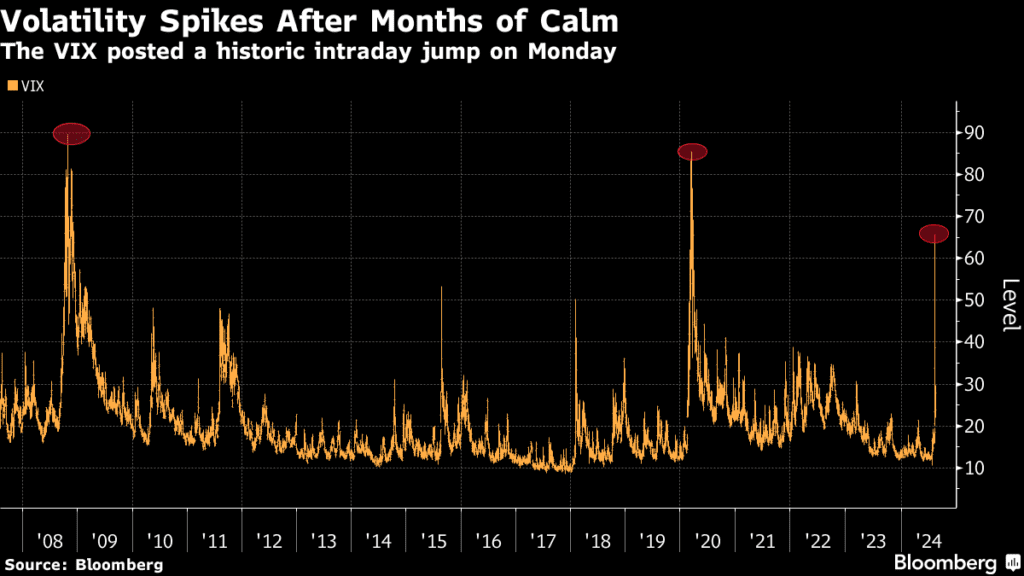
- 2008: Hits all-time high of 89.53 during financial crisis
- 2017: Reaches record low of 8.56
- 2020: Spikes to 82.69 at start of COVID-19 pandemic
Reading VIX Numbers
The VIX typically moves between 0 and 100:
| VIX Range | Market Sentiment |
|---|---|
| 0-20 | Low volatility, optimism |
| 20-30 | Normal conditions |
| 30+ | High volatility, uncertainty |
Traders often use the VIX as a reverse indicator. High VIX values might signal a good time to buy stocks, while low values could suggest selling.
Example: On February 28, 2020, a VIX spike coincided with the Nasdaq finding support. The Nasdaq then rose 27.5% by June 10, 2020.
Using VIX in Trading
Monitor daily VIX levels and look for spikes above the 10-day moving average. The VIX typically moves opposite to stock market indexes.
| VIX Level | Market Sentiment | Potential Action |
|---|---|---|
| Below 20 | Low volatility | Consider taking profits |
| 20-30 | Normal conditions | Monitor closely |
| Above 30 | High uncertainty | Look for buying opportunities |
Use VIX data to time market moves:
- Consider buying when VIX is high and decreasing
- Think about selling when VIX is low and rising
Remember, use VIX alongside other indicators for a complete market analysis./banner/inline/?id=sbb-itb-326557f
VIX Trading Tools
You can’t trade VIX directly, but there are related instruments:
- VIX futures: Contracts betting on future VIX levels
- VIX options: Rights to buy/sell VIX at set prices
- VIX ETFs/ETNs: Track VIX futures, easier for regular investors
Be aware: These products can have steep declines over time.
VIX Trading Methods
- Protecting investments: Use call ladder trades with VIX options
- Volatility arbitrage: Profit from gaps between VIX and futures prices
- Mean reversion trades: Bet on VIX returning to average levels
Remember: VIX-linked ETFs often don’t mirror VIX well.
VIX Trading Traps
- Misinterpreting VIX data: High VIX doesn’t always predict high actual volatility
- Ignoring futures price curves: Contango can lead to losses for VIX futures buyers
- VIX’s own volatility: Rapid VIX changes can catch traders off guard
To avoid these traps:
- Check market basics alongside VIX signals
- Understand contango and backwardation effects
- Watch VIX’s own changes closely
Wrap-up
Key takeaways:
- VIX reflects investor nervousness
- Has strong negative correlation with S&P 500
- Useful for short-term trading and hedging
- Affects options pricing
Keep learning:
- Stay updated on VIX trends
- Combine VIX with other indicators
- Practice careful risk management
- Study historical VIX data
- Explore VIX-based strategies
Remember: VIX is a tool, not a crystal ball. Use it wisely alongside other market indicators.