Imagine having an indicator that could provide insights into the emotional extremes driving the stock market. Enter the CNN Fear and Greed Index, a fascinating tool designed to help investors gauge market sentiment. In this comprehensive guide, we’ll explore the inner workings of this index, its components, and how to interpret and apply it to your investment decisions. Ready to uncover the power of emotions in the financial markets? Let’s dive in.
Short Summary
The CNN Fear and Greed Index is a market sentiment indicator that measures investor emotions using seven indicators.
It uses a 100-point scale to track investor sentiment, with 50 representing neutral emotion.
The index can be used to inform investment strategies by complementing fundamental analysis, identifying market reversals, and assessing risk appetite when used in conjunction with other tools.
Understanding the CNN Fear and Greed Index

The Fear and Greed Index is a market sentiment indicator that measures investor emotions on a scale of 0 to 100, with higher values indicating greed and lower values indicating fear. Developed by CNN Business, the index aims to assess whether stocks are being traded at fair prices by capturing the emotional factors driving stock prices. With the greed index calculated, it is based on the concept that excessive fear can drive share prices substantially lower than their intrinsic values, while excessive greed can drive stock prices substantially higher than their value.
To provide a comprehensive understanding of market sentiment, the index is calculated using seven market indicators, each reflecting different aspects of investor sentiment. The index is refreshed on trading days, helping investors stay up to date with prevailing market sentiment.
Origin and Purpose
Introduced in 2012 by CNN Business, the Fear and Greed Index was designed to help investors comprehend the emotional factors influencing stock prices. By tracking the prevailing sentiment of the US stock market, the index provides valuable insights into how emotions of fear and greed can impact stock market behavior and investment decisions.
Understanding the Fear and Greed Index can help investors make more informed decisions and avoid making costly mistakes.
The 100-Point Scale
The Fear and Greed Index employs a 100-point scale to measure investor sentiment. A reading of 50 represents a neutral sentiment, while values above 50 indicate greed and those below 50 signal fear.
This scale allows investors to quickly assess market sentiment and make informed decisions in response to the emotional climate of the financial markets.
Components of the CNN Fear and Greed Index
The Fear and Greed Index comprises seven market indicators, each reflecting different aspects of investor sentiment. These components provide a holistic view of market sentiment, helping investors identify trends and potential market reversals.
Let’s delve deeper into each of these components and their significance in the index. Each component is measured on a scale of 0 to 100, and the equal-weighted average of the indicators is then computed to calculate the greed index. This approach ensures a comprehensive assessment of market sentiment, capturing a wide range of data points and trends.
Market Momentum
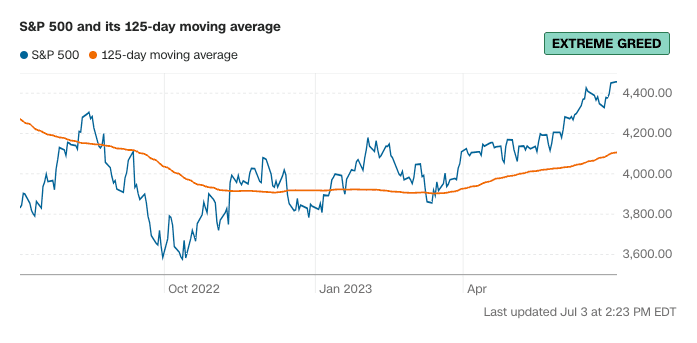
Market momentum, a reflection of stock market movements and stock price momentum, is an essential component of the Fear and Greed Index, measuring the performance of the S&P 500 relative to its 125-day moving average. Positive momentum indicates greed, while negative momentum signals fear.
By comparing the S&P 500 to its rolling average over the past 125 days, the index captures market trends and helps investors identify potential market reversals.
Stock Price Strength
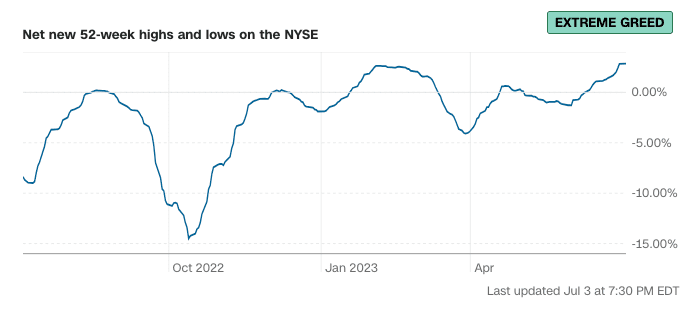
The strength of a stock price is measured with a comparison of the number of stocks on the New York Stock Exchange (NYSE) at their 52-week highs versus the same number at 52-week lows. This ratio gives an indication of a particular stock’s performance over the past year. A higher number of 52-week highs indicates greed, while a higher number of 52-week lows signals fear.
This component of the index provides insights into the overall strength of the stock market and helps investors gauge market sentiment.
Stock Price Breadth
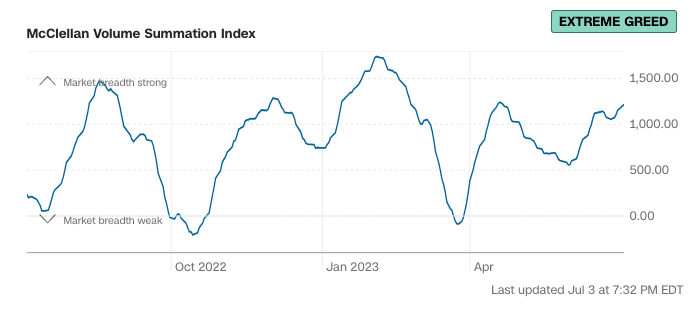
Stock price breadth is another crucial component of the index, assessed using the McClellan Volume Summation Index. This metric calculates the ratio of shares on the NYSE that are increasing versus the number of shares that are declining, with a rising volume indicating greed and a declining volume signaling fear.
By capturing the overall market breadth, this component helps investors understand the current market dynamics.
Put and Call Options
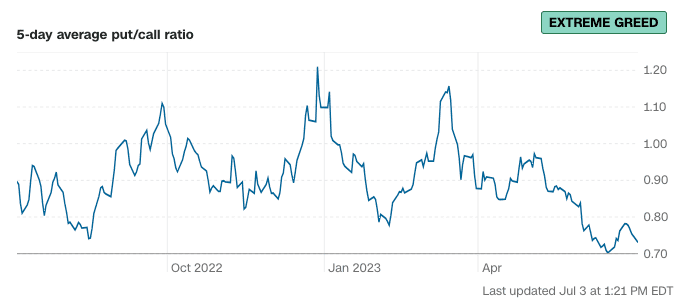
Put and call options play a significant role in measuring investor sentiment within the Fear and Greed Index. A rising put/call ratio indicates fear, while a falling ratio signals greed. By monitoring the 5-day average put/call ratio, the index provides insights into investor expectations and risk appetite, helping investors navigate the emotional landscape of the financial markets.
Related Article: Options Trading: A Beginner’s Guide
Market Volatility
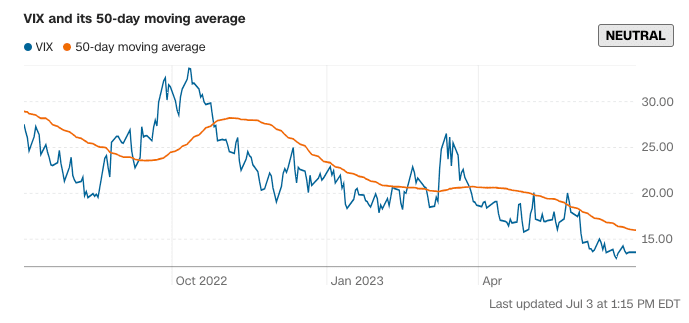
Market volatility is an essential component of the Fear and Greed Index, measured using the VIX, or the CBOE Volatility Index. Higher volatility signals fear, while lower volatility indicates greed. By capturing fluctuations in the S&P 500 Index options over the upcoming 30-day period, the index helps investors assess market risk and make informed decisions in response to changing market conditions.
Safe Haven Demand
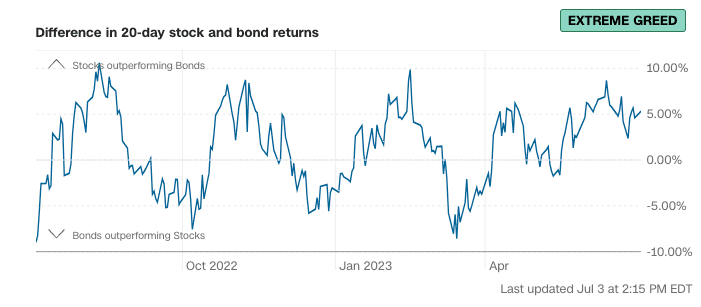
Safe haven demand is an important component of the Fear and Greed Index, comparing the 20-day returns of Treasury bonds and stocks. Higher bond returns indicate fear, while higher stock returns signal greed.
Junk Bond Demand
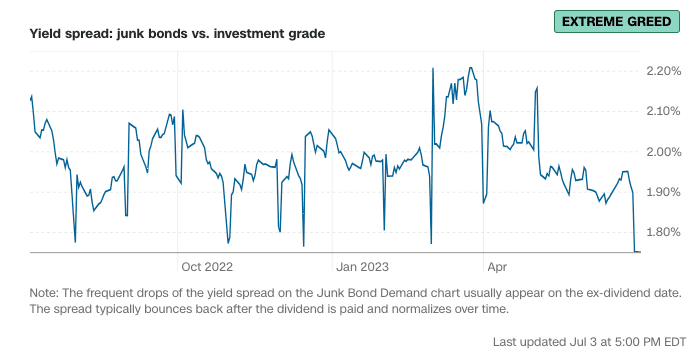
Junk bond demand is another crucial component of the index, measured through the yield spread between high-risk junk bonds and safer government bonds. A smaller yield spread indicates greed, while a larger spread signals fear. By capturing the demand for high-risk bonds in relation to safer alternatives, the index helps investors gauge market sentiment and make informed decisions based on their risk tolerance.
Interpreting the CNN Fear and Greed Index
Now that we’ve explored the components of the Fear and Greed Index, let’s discuss how to interpret the index and understand its historical context. By combining the readings of the index with historical data, investors can assess market sentiment and make more informed decisions in response to the emotional climate of the financial markets.
Remember that the index is not a standalone predictor of market movements, and should be used in conjunction with other indicators and analysis tools. By understanding the index’s readings and historical context, investors can gain valuable insights into market trends and sentiment and make more informed decisions in response to the emotional climate of the financial markets.
Reading the Index
Interpreting the Fear and Greed Index is straightforward. Readings below 45 indicate fear, while readings above 55 signal greed, with 50 being neutral. By monitoring these index ranges, investors can quickly assess market sentiment and adjust their investment decisions accordingly.
Historical Context
Examining the historical data of the Fear and Greed Index can provide valuable insights into past market events and trends. By monitoring the index’s score over time, investors can recognize patterns and trends, such as market cycles, market sentiment, and market volatility.
Comparing current scores to prior scores can also help determine if the market is overbought or oversold, providing additional context for investment decisions.
Practical Applications of the Fear and Greed Index
The Fear and Greed Index can be applied in various ways to enhance investment strategies. By complementing fundamental analysis, identifying market reversals, and assessing risk appetite, the index provides valuable information to help investors make more informed decisions in response to market sentiment.
It is important to remember, however, that the index should be used in conjunction with other technical and fundamental tools to gain a more comprehensive understanding of market trends and sentiment. By diversifying analysis tools, investors can gain a more complete perspective of the market and make more informed decisions.
Identifying Market Reversals
The index can help identify potential market reversals by signaling when investor sentiment is at extreme levels. For instance, if the index is at 0, it may suggest that the market is oversold and due for a reversal. Conversely, if the index is at 100, it may suggest that the market is overbought and due for a reversal.
Assessing Risk Appetite
The Fear and Greed Index can be used to evaluate market risk, with high fear suggesting risk-aversion and extreme greed indicating optimism. By monitoring the index’s readings, investors can gauge their own risk appetite and adjust their investment strategies accordingly.
This can be particularly useful in volatile markets, where investor sentiment can shift rapidly and impact asset prices.
Limitations and Considerations
While the Fear and Greed Index offers valuable insights into market sentiment, it is essential to recognize its limitations. The index is not a standalone predictor of market movements and should not be relied upon exclusively. Instead, investors should diversify their analysis tools and consider other market indicators and trends to gain a more comprehensive understanding of market sentiment.
Diversifying Analysis Tools
Investors should diversify their analysis tools to gain a more comprehensive understanding of market trends and sentiment. By utilizing multiple analysis tools, such as:
Technical analysis
Fundamental analysis
Sentiment analysis
Quantitative analysis
Summary
The CNN Fear and Greed Index is a powerful tool that can help investors gauge market sentiment and make more informed decisions in response to the emotional climate of the financial markets. By understanding the index’s components, interpreting its readings, and acknowledging its limitations, investors can integrate the index into their investment strategies and navigate the world of finance with greater confidence. After all, mastering the art of investing is not just about crunching numbers; it’s also about understanding and managing the emotions driving the market.
Frequently Asked Questions
What is the fear and greed index?
The Fear & Greed Index is a useful tool to track stock market movements, taking the emotions of fear and greed out of the equation. It measures seven indicators, such as market momentum, stock price, and put/call ratios, to establish whether prices are inflated or undervalued. As a result, investors can make better informed decisions on when to buy and sell stocks.
How is the Fear and Greed Index calculated?
The Fear & Greed Index is determined by aggregating seven market indicators, representing investor sentiment, and weighing them equally to determine the resulting index.
What are the seven market indicators used in the index?
The seven market indicators commonly used to measure the overall performance of the stock market are Market Momentum, Stock Price Strength, Stock Price Breadth, Put and Call Options, Market Volatility, Safe Haven Demand, and Junk Bond Demand.
Collectively, they give a good indication of the health of the stock market as a whole.
How can the Fear and Greed Index be used in investment strategies?
By assessing the Fear and Greed Index, investors can gain insight into overall market sentiment, helping to identify when it may be prudent to increase or decrease exposure in their portfolio. Knowing when to adjust their position could lead to more optimal outcomes.