Midterm Election Insights
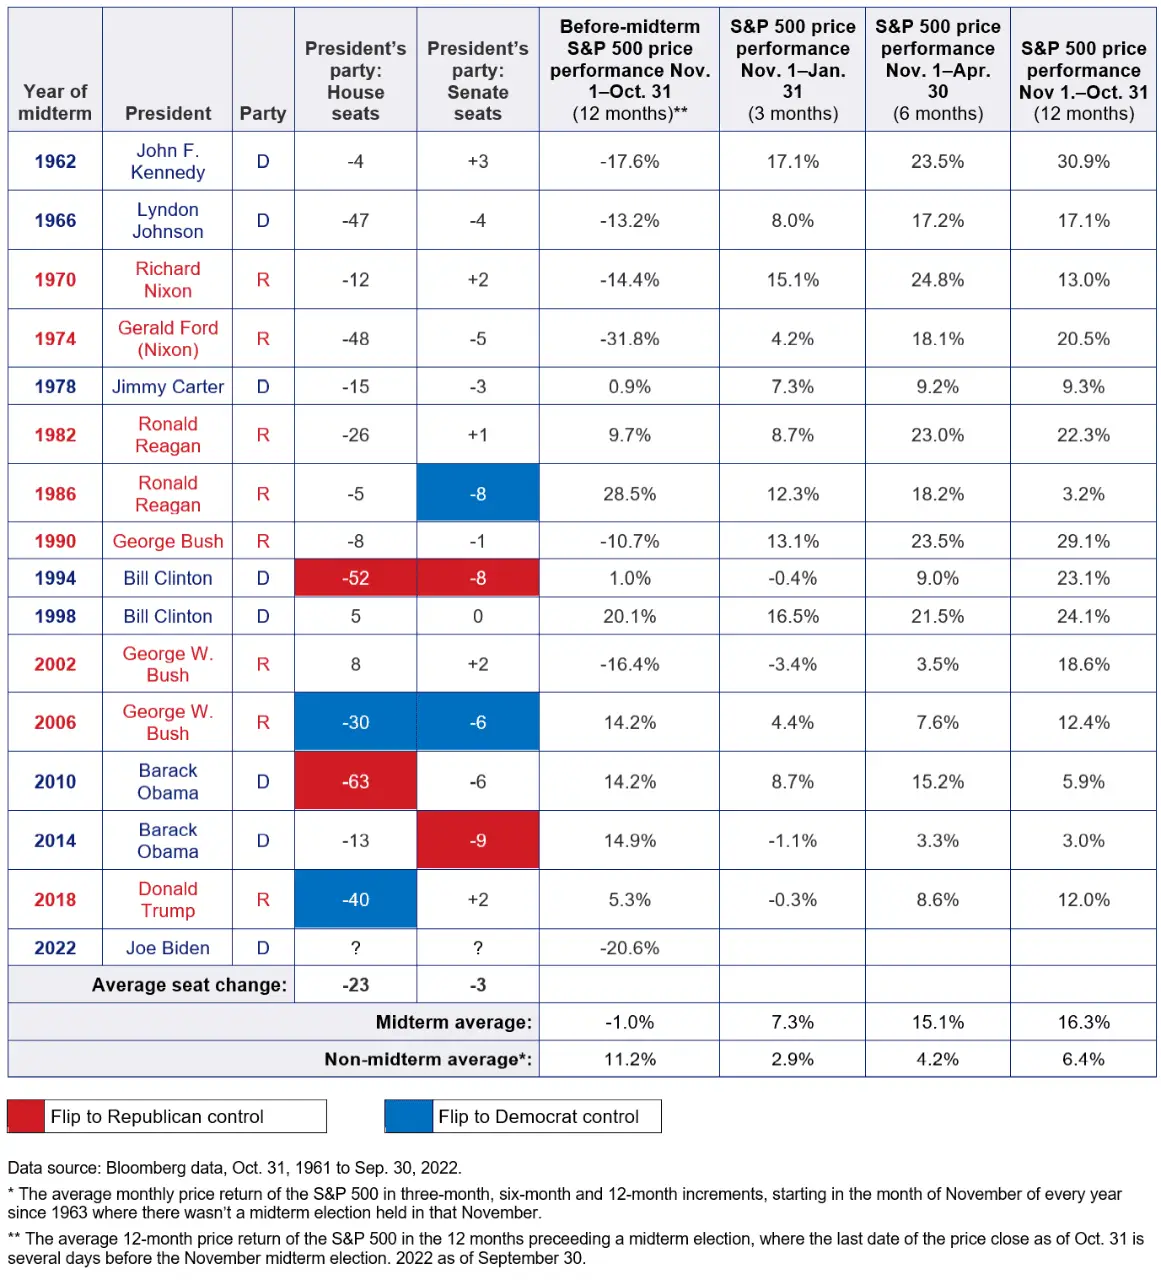
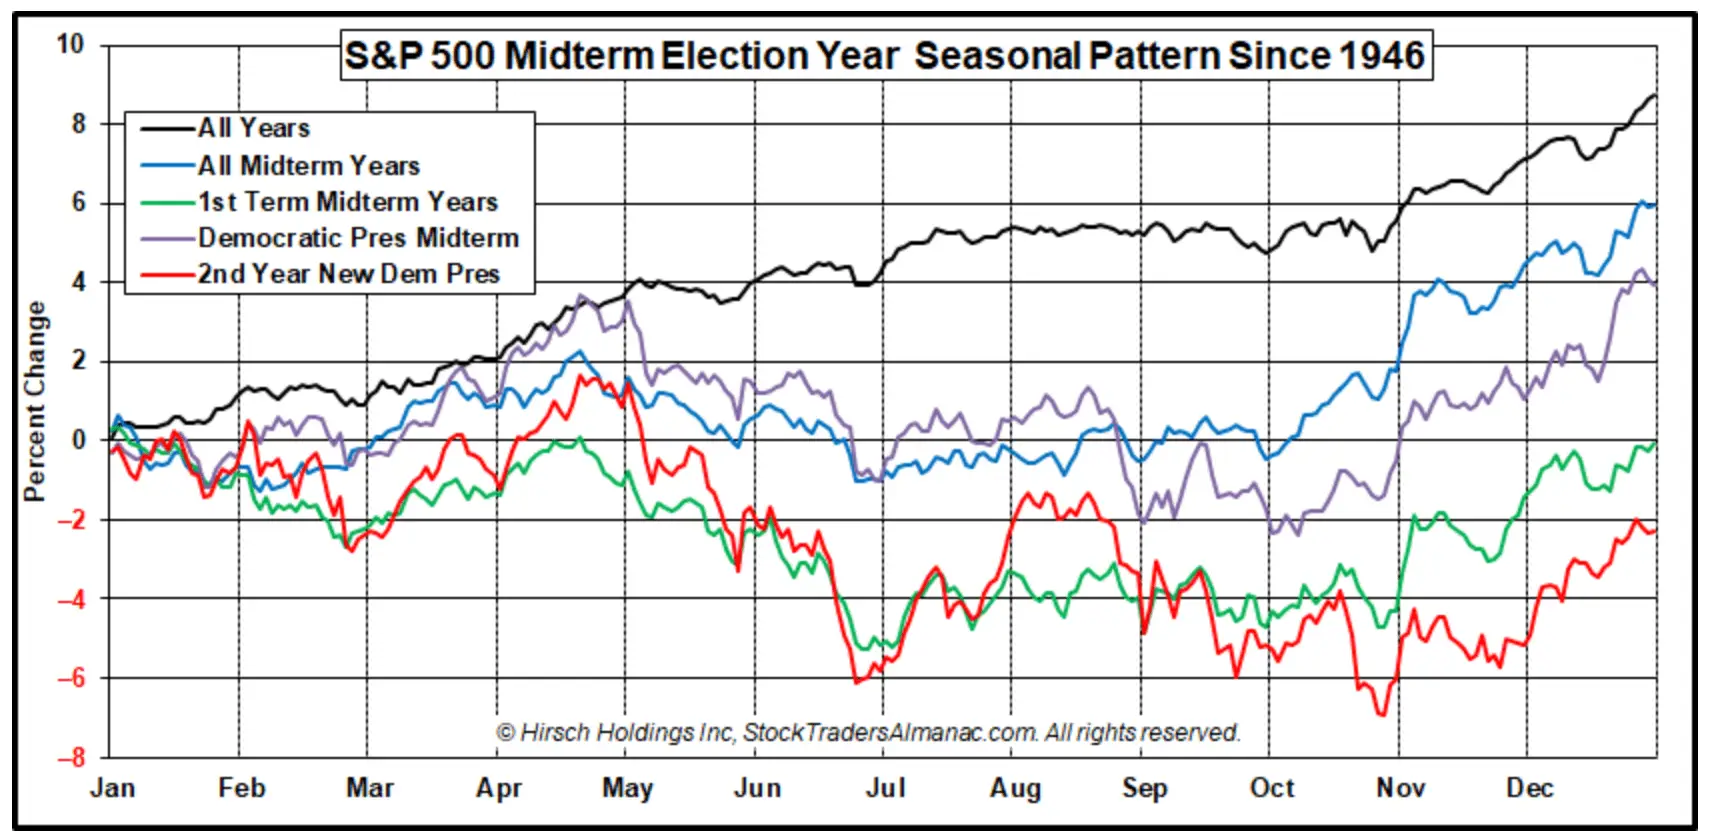
Since the 1946 midterm elections, the stock market has had a perfect track record of seeing positive returns one year after a midterm election cycle. Even more notable, the average one year return before a midterm election has been 0.3%.
With midterms fast approaching on November 8th, traders are rushing to position themselves. The rise in volume from market participants causes an increase in volatility, especially in the S&P 500 index options. So, given the economic headwinds currently at stake, will 2022 be the year to end the perfect record?
Stock Market Returns Before Midterm Elections
So far in 2022, the S&P 500 index is down roughly 16% year over year. Given that the average one year return before a midterm election is 0.3%, it would be ideal to say that 2022 has been a difficult year for equities leading up to midterms. For comparison, in the 1974 midterm election cycle, the S&P 500 saw a -31.8% return in the 12 months prior.
One possibility for the lack of positive returns before a midterm election could be investor anxiety over the outcome. The political party that wins the Senate majority will have a ruling over fiscal policies that can affect stocks on an individual level.
From the broad market perspective, there is no statistical evidence that says a change of political party affects the overall index returns after a midterm election. What does persist is that investors will use a “wait and see” approach or take the time to reposition their respective holdings. This adds to the broad stock market weakness.
Stock Market Returns After Midterm Elections and Seasonal Pattern
As noted, since 1946, the one year return after midterm elections has been positive in all 19 cases with an average return of 16%. The only time period to have a net negative 12 month return post elections was in the 1930s during the Great Depression. According to data from CNBC, the best performing era was in the 1954 midterm election where the S&P 500 rose a staggering 33.6% in the year following the election. The question to be foreseen is, will the S&P 500 continue its perfect track record going 20 for 20? Given that economists are now pricing in a 96% chance of a recession, 2023 could be the year to end the perfect record.
To paint a better picture of this, it’s important to understand the 12 months after the 1986 midterm elections when the stock market only rose 3.2%. A strong 4 year bull market from 1982-1986 was cut dead in its tracks when the stock market had one of the worst crashes in history.
Known as the Black Monday crash in October of 1987, the stock market fell a staggering 22.6% in one trading session. Even more notable, the indexes managed to recover all of those losses plus the 3.2%. All of this within one year following the midterm elections. It is safe to say that this perfect track record is one to be reckoned with.
Implied Volatility Before and After Midterm Elections
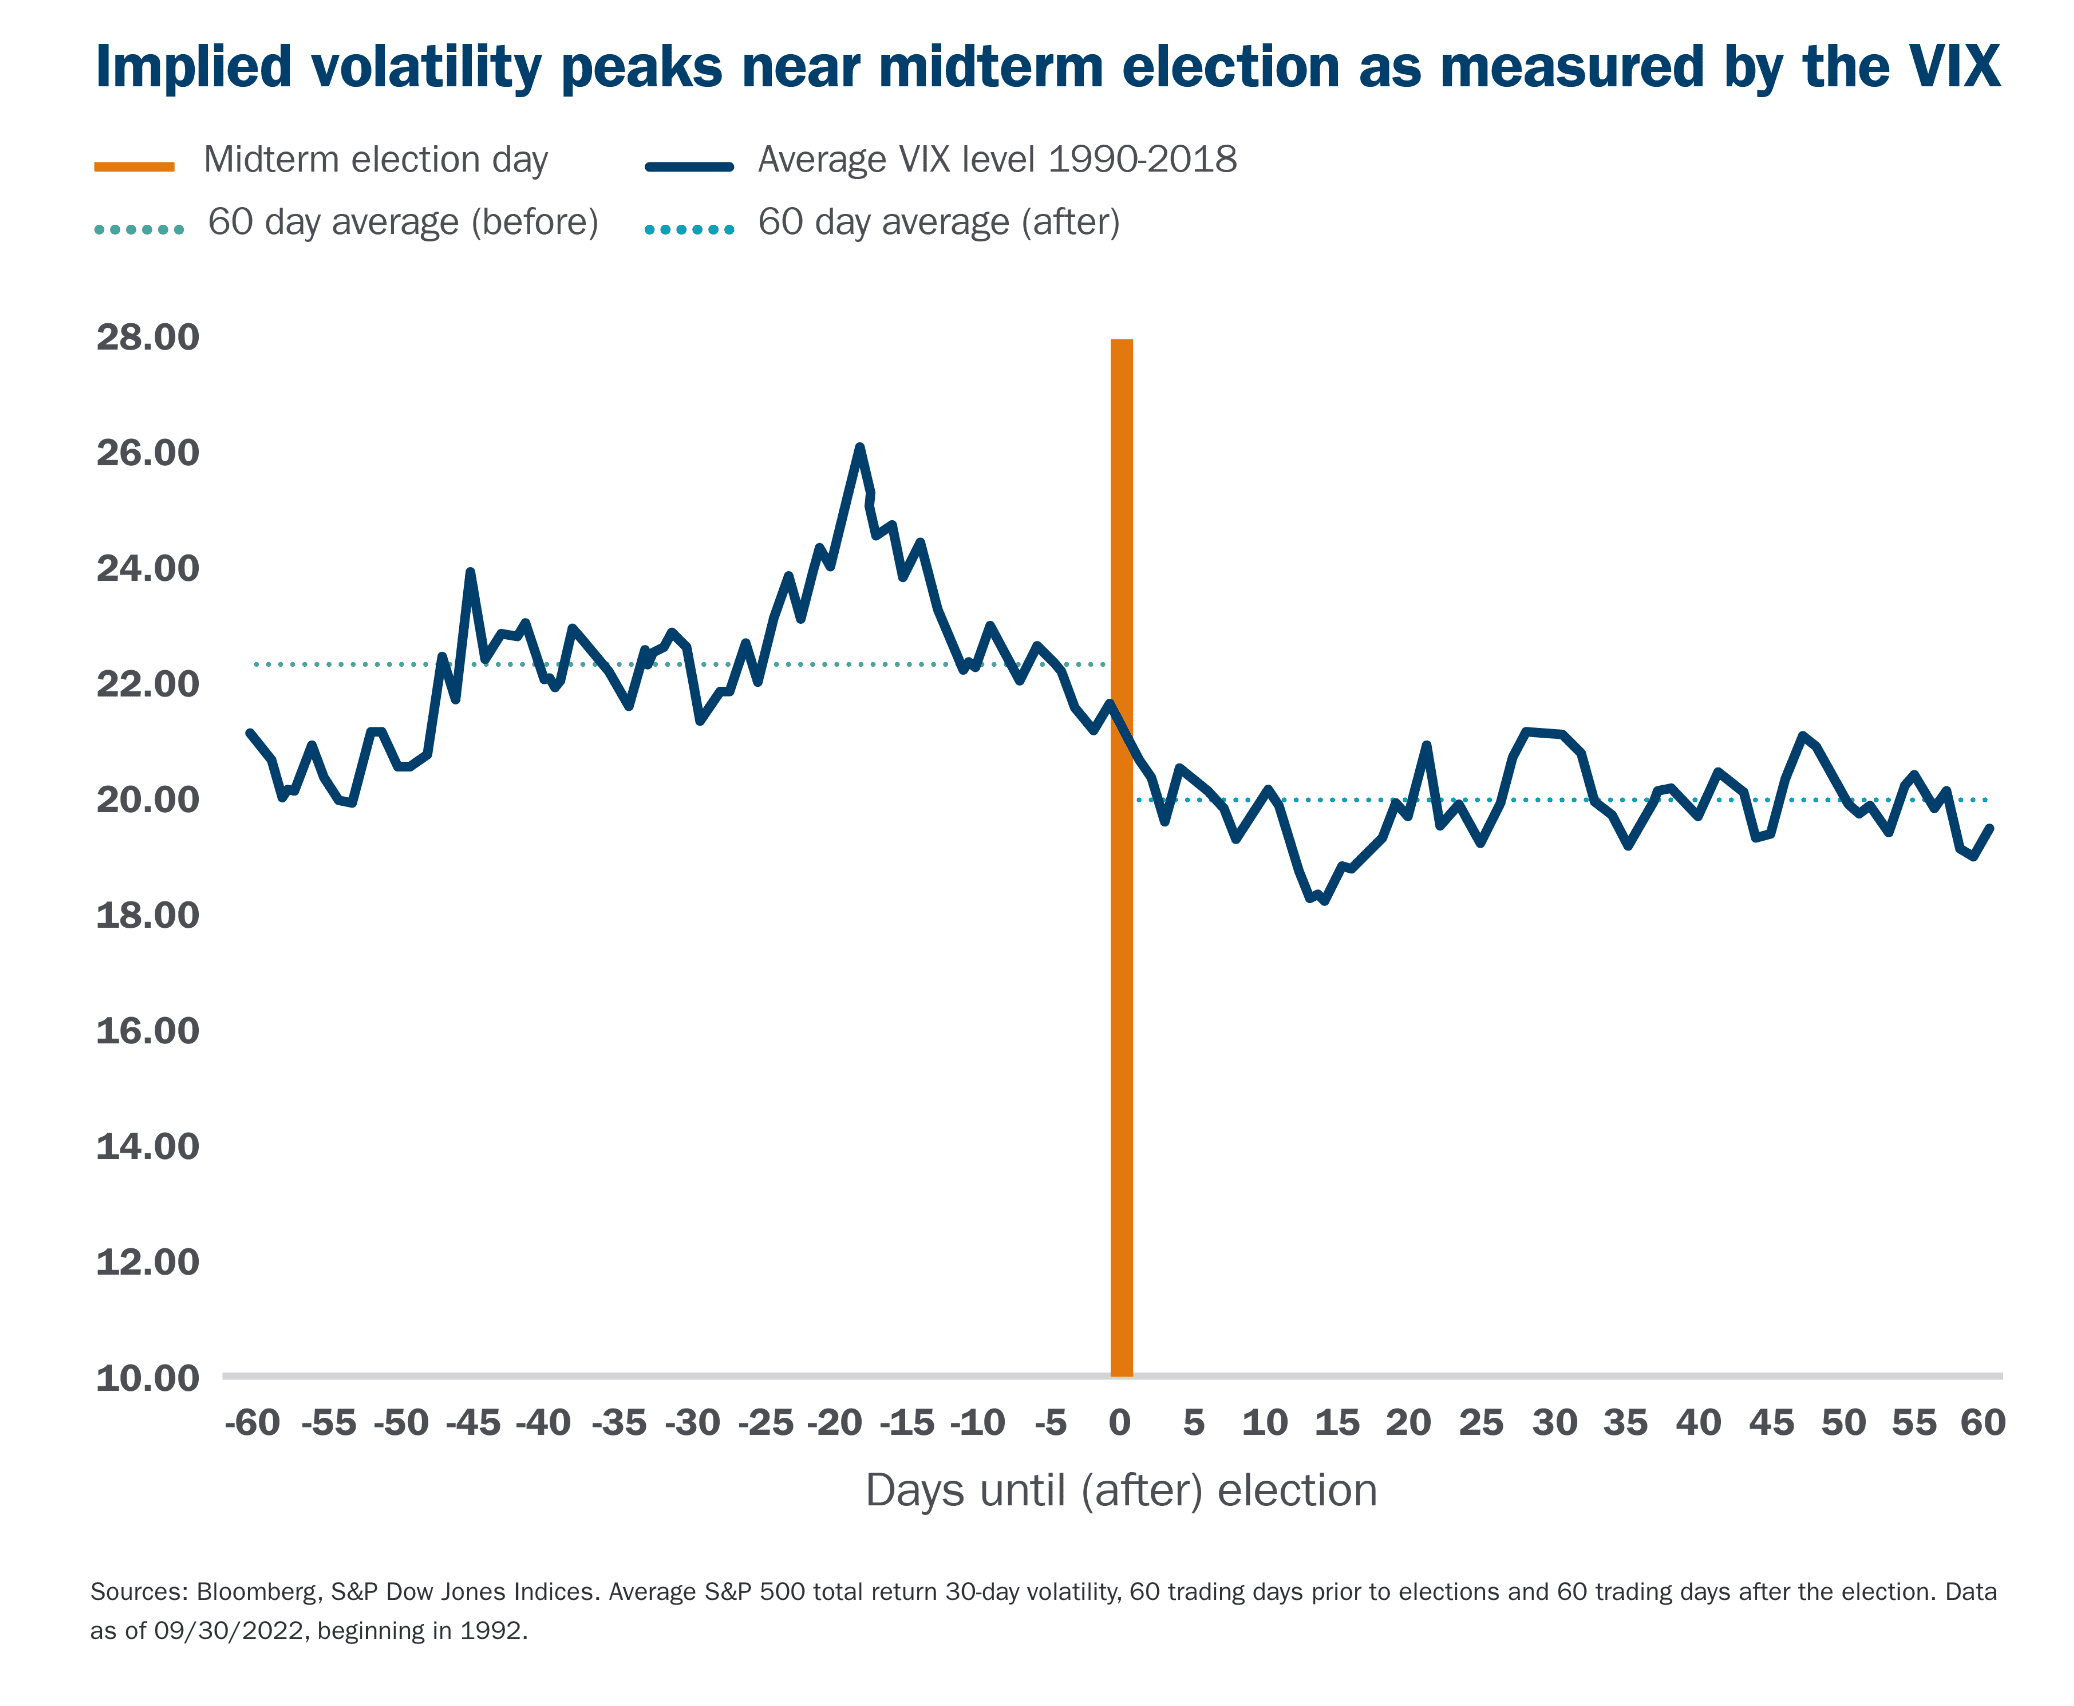
2022 has been the year of stock market volatility. Investors are accustomed to the intraday 1% price swings that have taken place throughout the year. Historically speaking, implied volatility as measured by the VIX, tends to increase in the lead up to midterm elections and will normalize the month following the election.
Currently with a VIX reading of 30, the market implies that the S&P will have daily price swings of 1.8%. This is substantially high as the VIX tends to sit in the teens. The general rule for options sellers is when the VIX is above 30 it is a good time to sell volatility and vice versa. As shown in the chart, volatility tends to drop off once the uncertainty of which party takes control of the House and Senate.
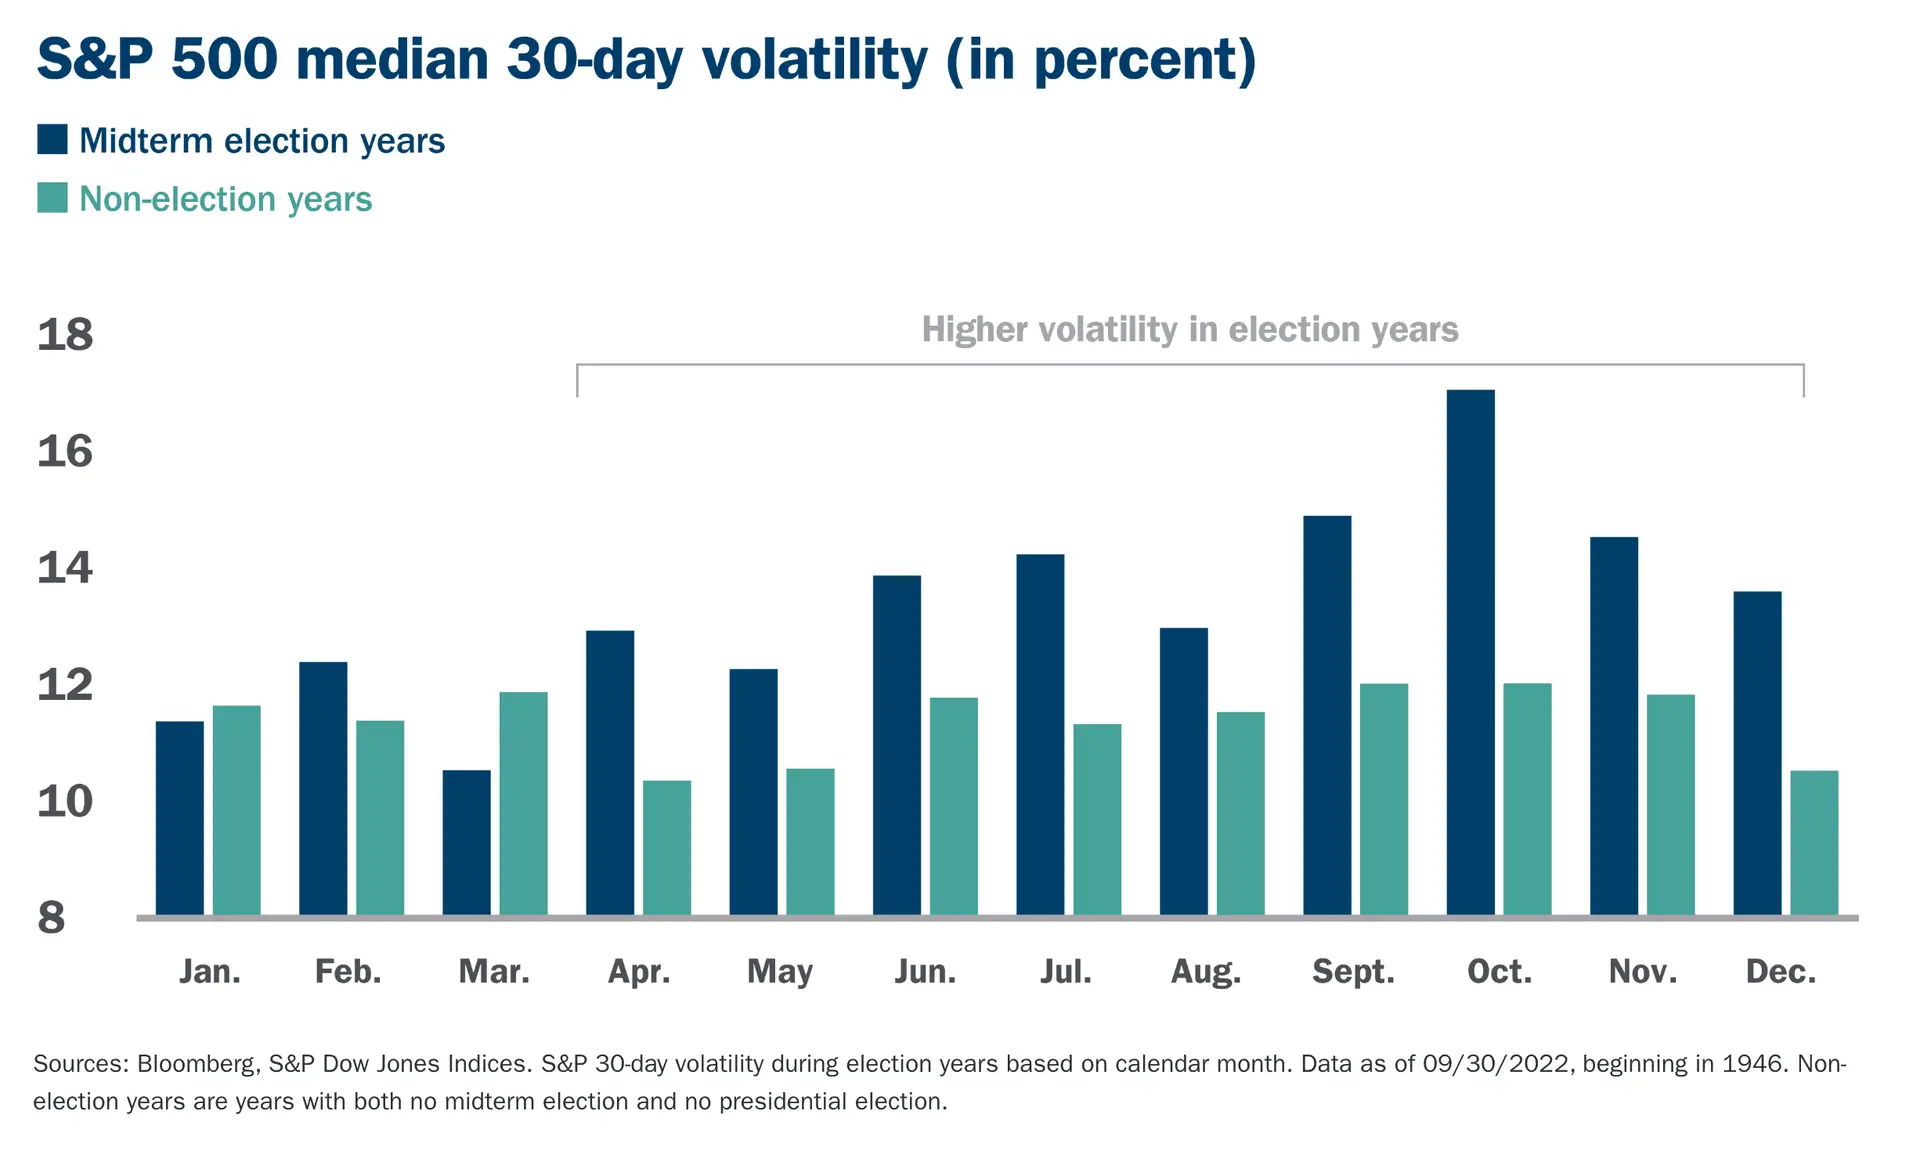
Realized Volatility Before and After Midterm Elections
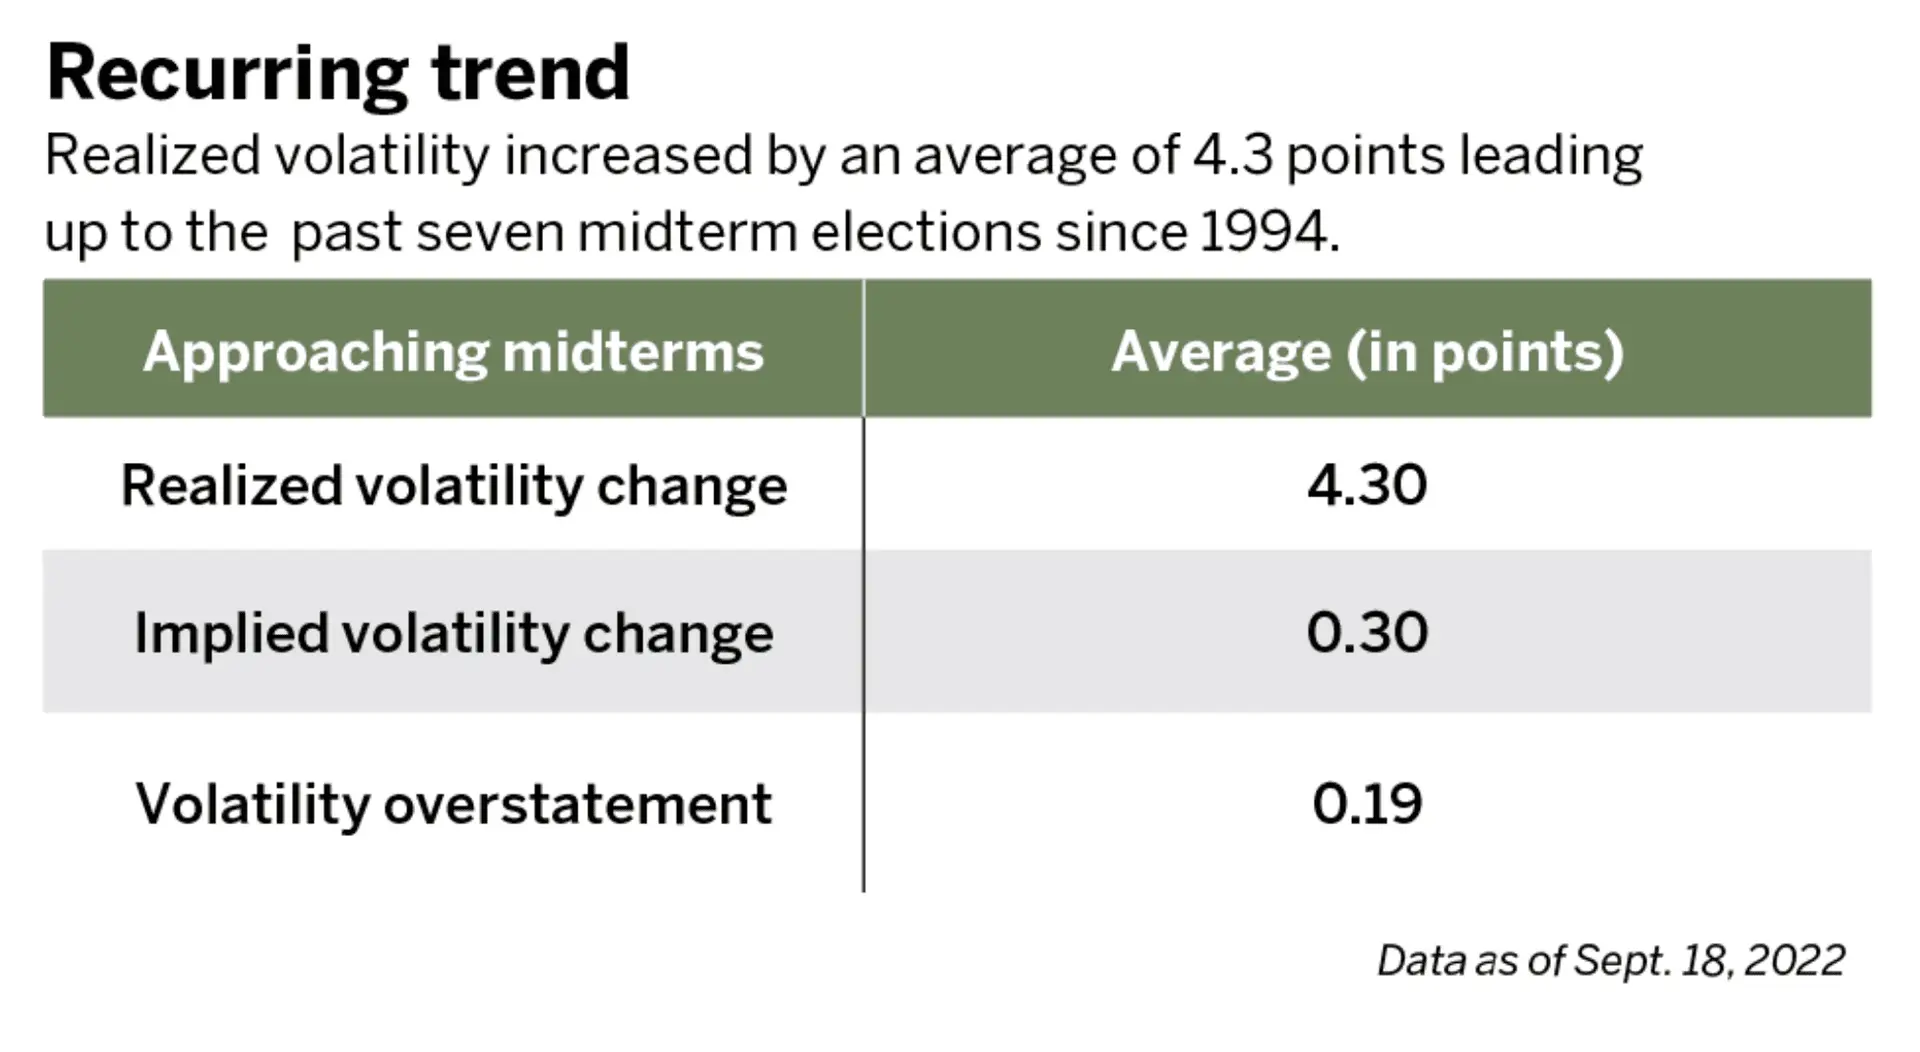
Just like implied volatility, realized volatility tends to increase before the midterm elections. While implied volatility is the market’s future expectations of daily moves, realized volatility is historically looking. It shows over a given time period how far the stock deviates from the mean.
On average, implied volatility tends to overstate realized volatility by 57% in the months leading up to midterm elections. More notably, the chart illustrates that realized volatility increases drastically leading up to midterms. This shows that investors are confused as to what direction the stock market will go, therefore larger price fluctuations take place.
Consumer Price Index (CPI) Effects on Stock Market Volatility
The consumer price index or CPI is one of the Fed’s preferred inflation measures to gauge future rate hikes. With CPI on November 10th, only two days after the elections, it could throw a curveball into the market progress and add to implied volatility.
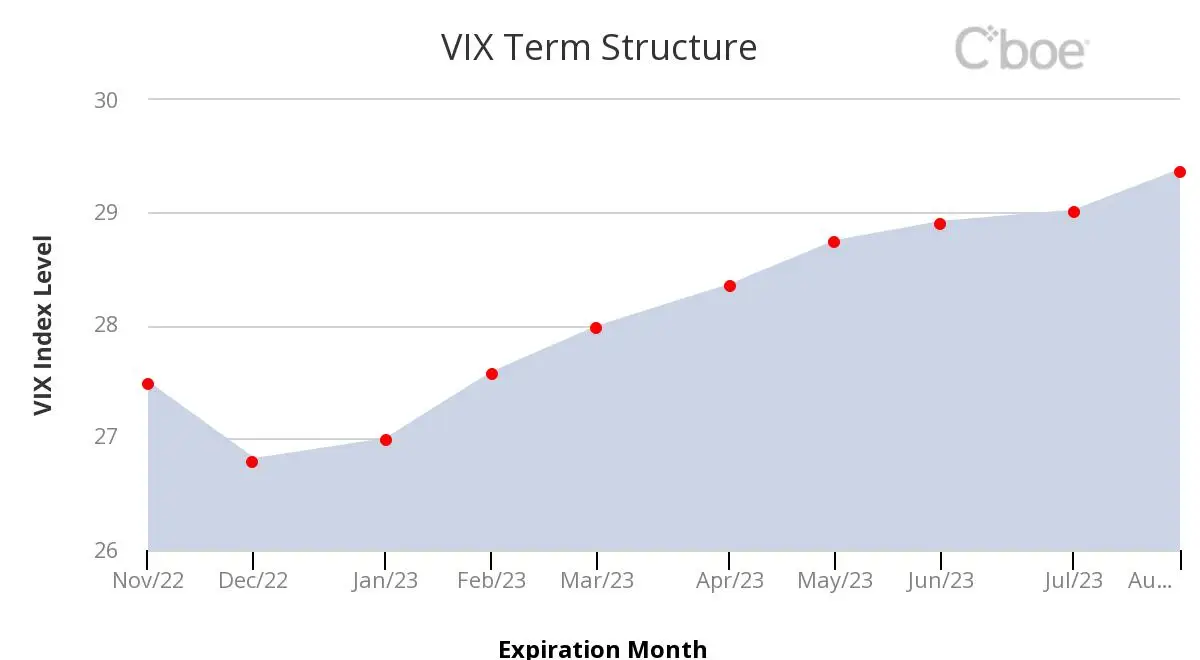
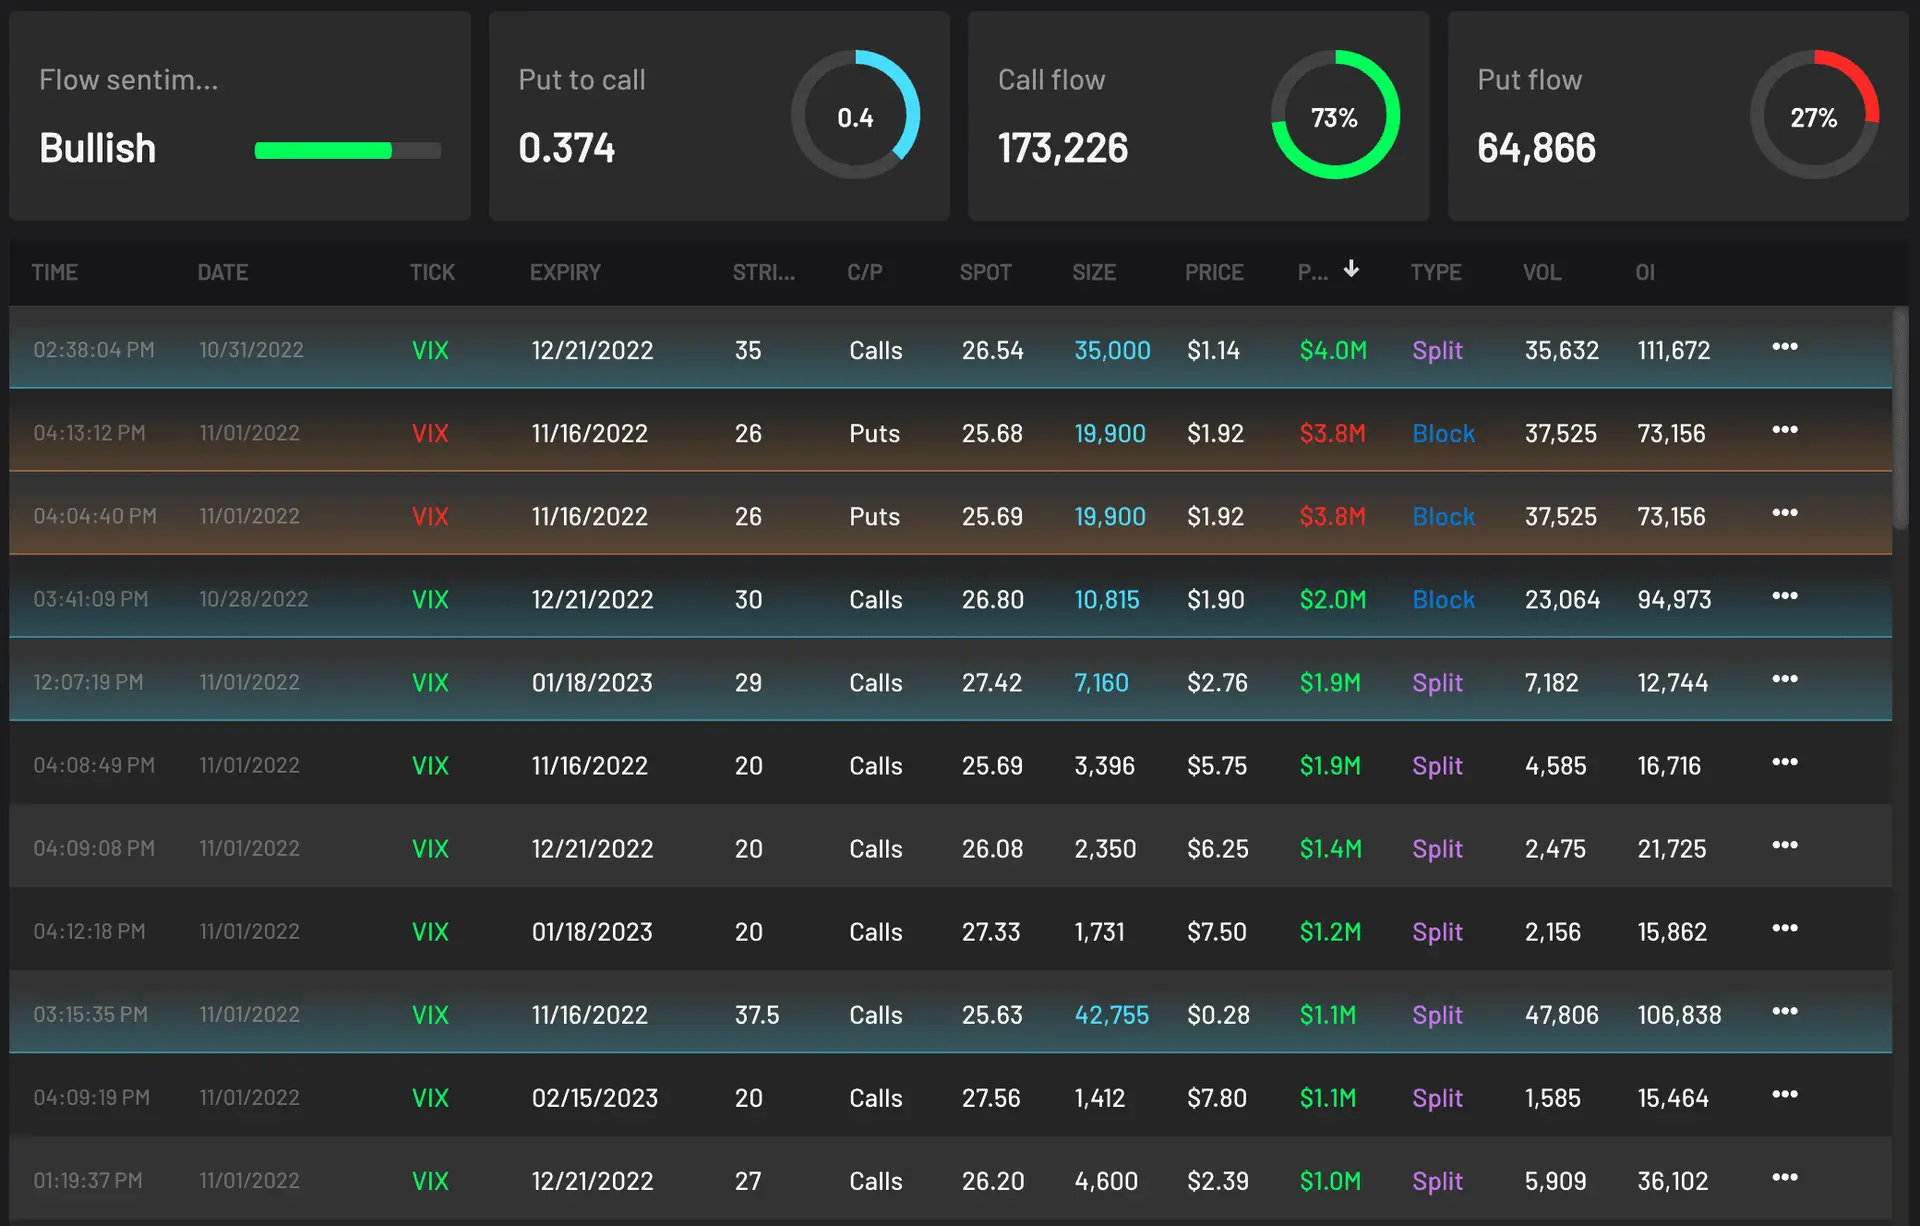
Below is a chart of the VIX term structure from CBOE. As we can see, the VIX futures are in contango, meaning that the months ahead are more expensive than the spot price. The market expects future volatility of the VIX to rise over the designated time period. This in turn, adds to larger price movements as shown in the VIX. Using the historical tab on Cheddar Flow from October 28th to November 2nd, we can see that the largest orders line up with the term structure.
Closing Thoughts
While the upcoming midterm seasonality path is unknown, what is known to investors and traders alike is the macroeconomic headwinds and volatile backdrop that the stock markets has seen. The perfect track record of the S&P 500 going 19 for 19 in rising one year after the elections, will definitely be a hard record to break. Throw in the war with Ukraine, inflation, quantitative tightening from the Federal Reserve, and many other factors, traders will be looking forward to the volatile backdrop in 2023, while investors should deploy a wait and see method.
Chart data provided by usbank, moneyshow, ameriprise, luckboxmagazine, CBOE