Options chains serve as a vital tool for traders and investors, providing them with the necessary information to analyze and make informed decisions in the options market.
We will guide you through the process of reading and analyzing options chains, discuss their significance for traders, and introduce advanced techniques to enhance your understanding of this essential tool.
Short Summary
Options chains are essential for successful options trading, providing traders with a comprehensive overview of the available options.
Analysis of trading volume and open interest can provide valuable information to inform investment decisions and improve strategies.
Advanced techniques involve mastering Options Greeks and implied volatility to refine strategies for increased success.
Exploring the Options Chain
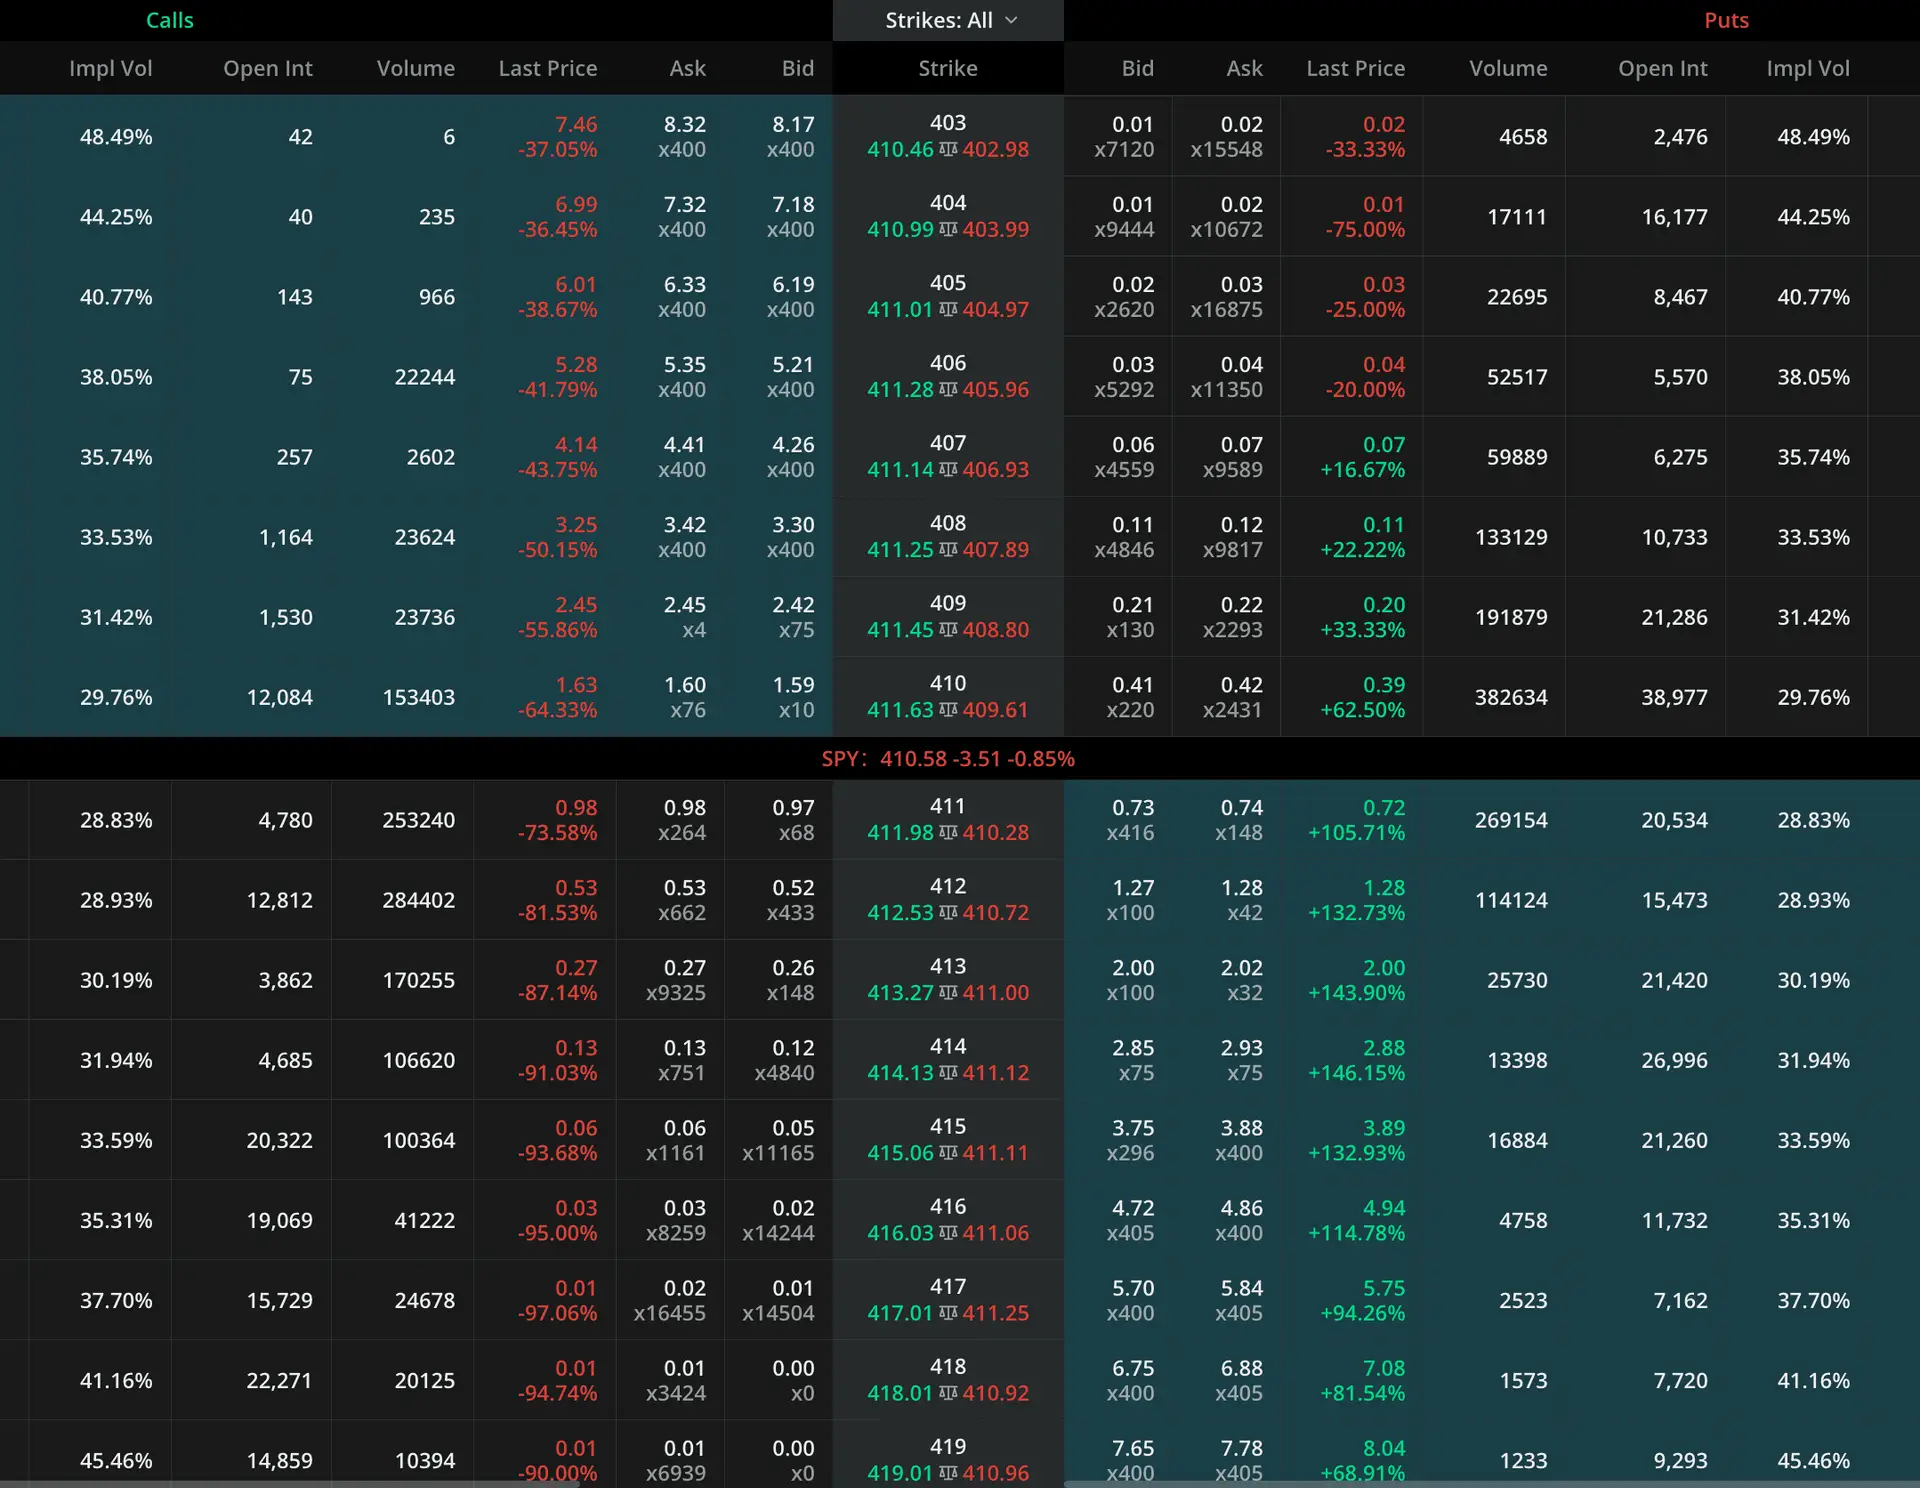
An options chain is a listing of all available options contracts for a given security, comprising puts, calls, expiration dates, strike prices, and pricing information. It serves as a concise overview of the asset’s available options, allowing traders to analyze market trends, liquidity, and depth of each individual strike, and make informed decisions on which options to trade.
Components of an Options Chain
To successfully navigate an options chain, it is essential to understand its components. These include the strike price, expiration date, option type (call or put), premium, open interest, implied volatility, and volume. Each of these components plays a significant role in options trading and analysis.
For example, the strike price sets the cost of the option, while the expiration date determines when the option will expire. The option type defines whether the option is a call or put, and the premium indicates the cost of the option. Open interest represents the number of contracts that have been opened but not yet closed, while implied volatility indicates the expected volatility of the underlying asset. Finally, volume shows the number of contracts that have been traded.
Navigating the Options Chain
Option chains present option quotes in an easy-to-understand sequence, allowing traders to find an option premium by following maturity dates and strike prices. This organized layout enables traders to quickly scan activity, trading volume, and interest, making it easy to locate relevant information and identify potential opportunities.
Data in an options chain is typically sorted by expiration date, starting with the nearest term. After the expiration date, the further refinement of strike prices is done, with the lowest strike prices placed at the top. This organization allows traders to efficiently survey activity, trading volume, and open interest for each option in the chain.
Tips for Interpreting Options Chains
When interpreting options chains, there are several tips and tricks that can help you make the most of the available information. One useful approach is to examine the bid/ask spread, implied volatility, and delta. Understanding how these factors interact can help you identify potential trading opportunities and make informed decisions in the options market.
For example, a narrow bid/ask spread may indicate a more liquid market, while a high implied volatility may signal increased uncertainty about the future price of the underlying asset. By considering these factors and other data points, you can develop a more comprehensive understanding of the options market and enhance your trading strategies.
Advanced Techniques in Options Chain Analysis
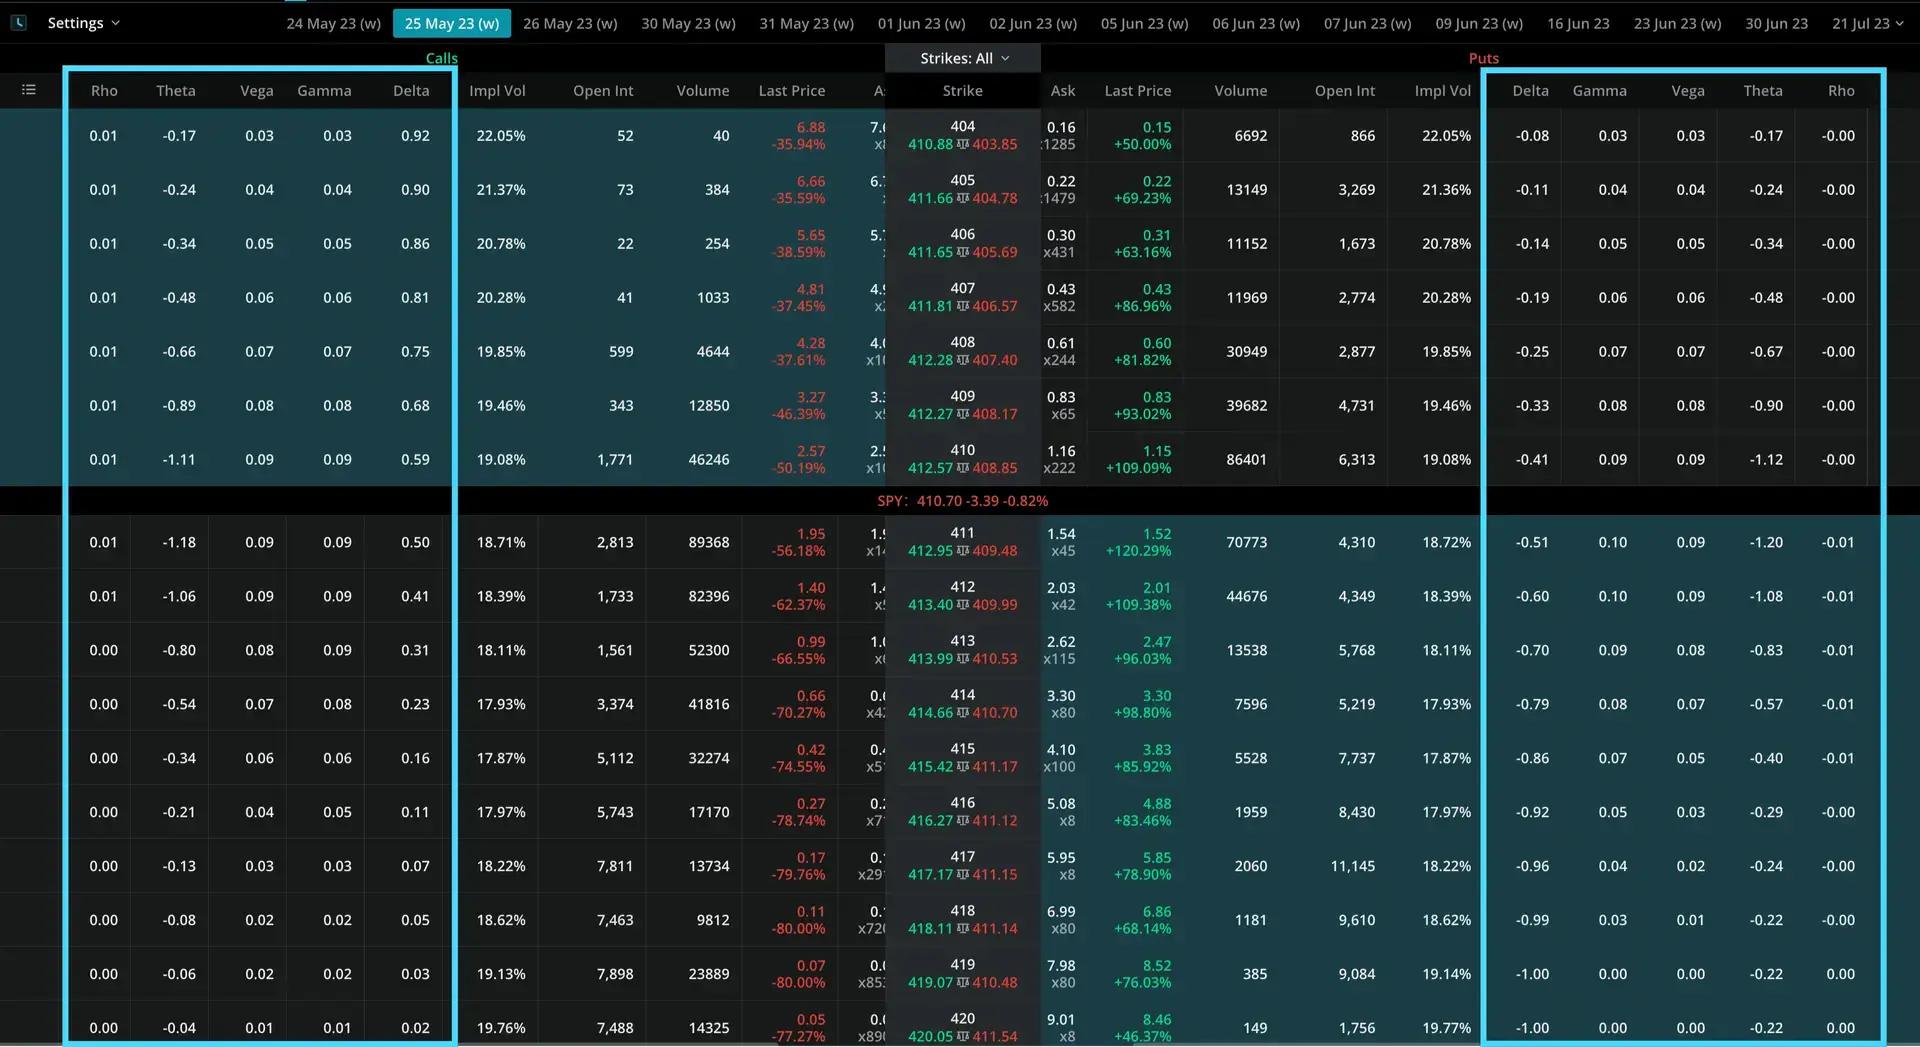
Advanced techniques in options chain analysis include understanding the options Greeks (delta, gamma, theta, vega, and rho) and implied volatility.
Options Greeks
Options Greeks are a set of financial metrics that measure the sensitivity of an option’s price to various factors, such as changes in the price of the underlying asset, volatility, or interest rates. These metrics, commonly known as delta, gamma, theta, vega, and rho, can be used by traders to gain insight into how changes in market conditions may impact the price of an option.
For example, delta measures the sensitivity of an option’s price to changes in the price of the underlying asset, while gamma measures the sensitivity of the option’s delta to changes in the asset’s price. Theta quantifies how the option’s price will change in response to changes in the time until expiration, while Vega measures the sensitivity of the option’s price to changes in the volatility of the underlying asset. Lastly, rho measures the sensitivity of the option’s price to changes in interest rates.
By understanding and utilizing the options Greeks, traders can better manage the risks and rewards associated with their options strategies.
Implied Volatility
Implied volatility is a metric used by investors to estimate the expected volatility of a security’s price based on specific predictive factors. It can be determined using various mathematical models, such as the Black-Scholes model, binomial model, or Monte Carlo simulation.
Investors use implied volatility to evaluate the risk of a security and to estimate the potential return on an investment. It can also be used to calculate the price of an option.
Summary
In conclusion, understanding and effectively analyzing options chains is crucial for success in options trading. By mastering the basics and incorporating advanced techniques, such as options Greeks and implied volatility, you can gain valuable insights into the options market and develop more effective trading strategies.
Keep refining your trading strategies, stay informed about market trends and changes, and continue learning and growing as a trader.
Frequently Asked Questions
What is the options pricing chain?
The Option Pricing Chain is an organized display of the prices and terms associated with a given option contract. It includes information such as strike prices, expiration dates, implied volatility, open interest, pricing data, Greeks, and more.
The chain provides insight into the price movements of an option contract and allows traders to identify potential trading opportunities.
Does Robinhood have an options chain?
Yes, Robinhood offers an options chain for users to view and trade. The pricing information shown on the chain sheet is in real-time, making it easy to track stock movements and trading opportunities.
What is the benefit of option chain?
It can be used as a tool to assess depth and liquidity in a particular strike. In addition to allowing for the analysis of options premiums, the system allows traders to determine the corresponding maturities and strike prices. Option chains provide alerts against breakouts and sharp movement of the index.