Market Analysis
Apple is the largest holding in the S&P 500 with roughly a 7% weighting on the index. Few events during the stock market calendar year get as many people excited as they are for Apple earnings. Market participants will use options to hedge their directional exposure to the earnings event in the form of puts if they are long shares and calls if they are short shares.
The massive influx to Apple’s options will cause implied volatility up and down the chain to increase far more significantly than what is implied during non-earnings times. In September, Apple canceled its plans to ramp up production for the iPhone 14 plus line.
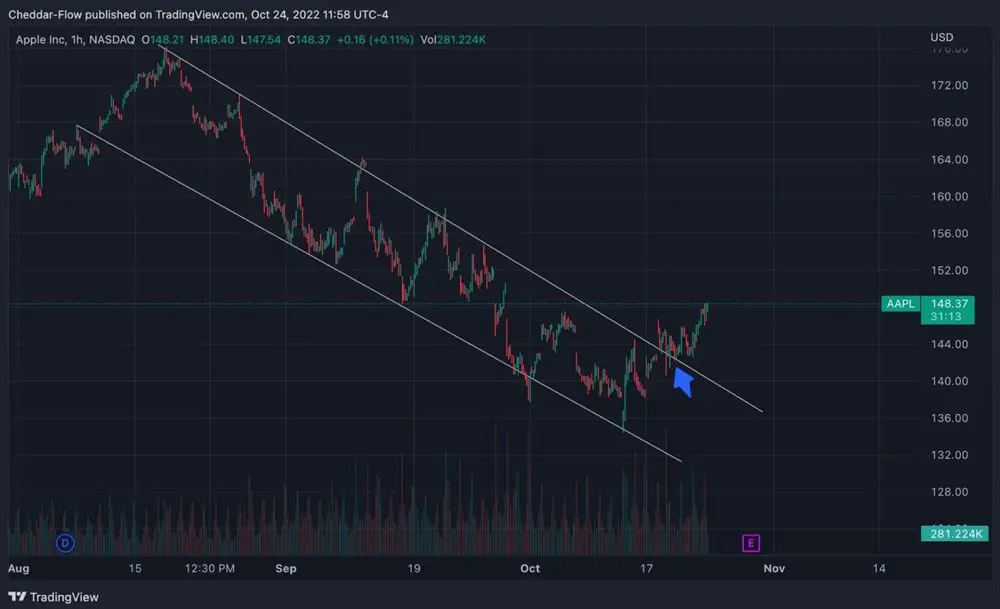
Recently in October, Apple announced its plans to cut production of the iPhone 14 plus line due to a lack of demand. This sent the stock tumbling about $4 and spiking implied volatility. Here is a current chart breakdown of Apple. The earnings announcement is after the market closes on Thursday, October 27th.
Approaching Apple Earnings with A Trading Strategy
Some possible ways to trade this is by shorting volatility through the earnings event in the form of two methods. Each with its own expected outcomes. These two strategies will need either a net debit, or receive credit (harvest premium) when entering the trade.
Each strategy will have different margin requirements. As always, options are risky and you can lose 100% of your money when trading them, these methods are for advanced traders to take advantage of. Even if you don’t trade options, this insight can help understand what is going on behind the scenes with regard to volatility if you are long or short Apple shares.
Metrics and Analysis
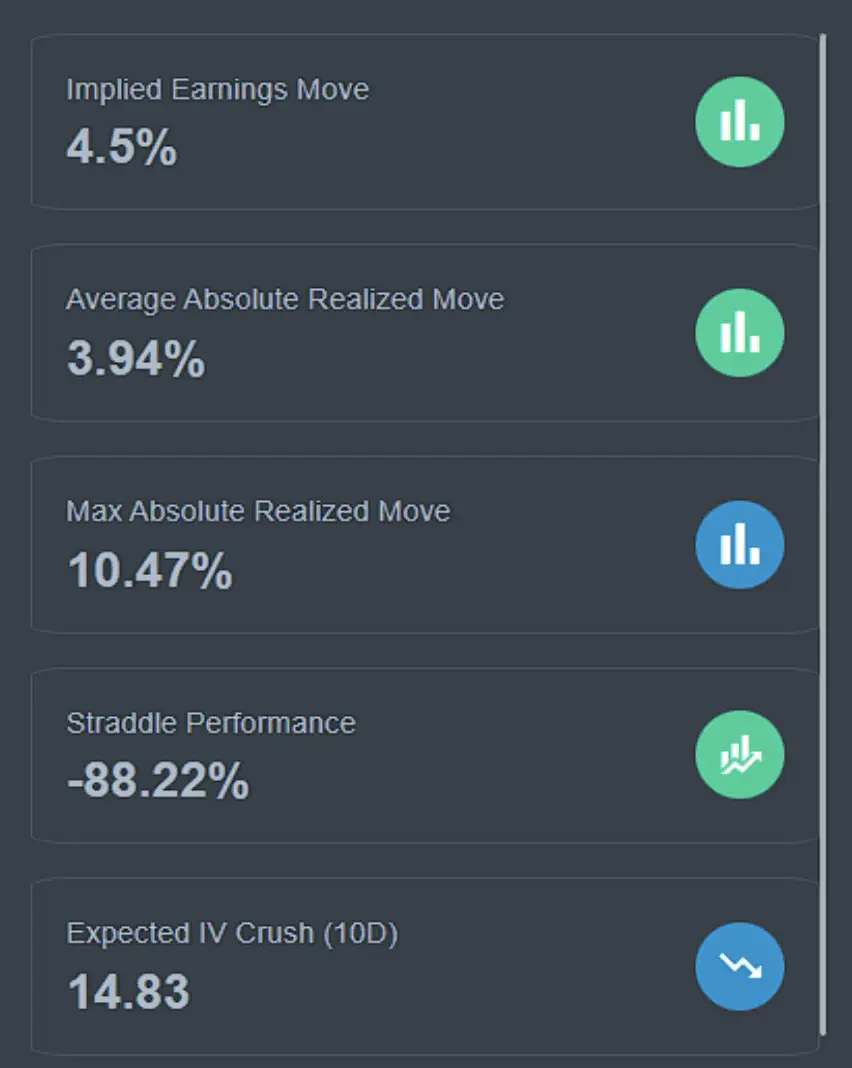
The options market is implying a 4.5% move post-earnings announcement, as shown in the image below. The average realized move post-event is 3.94% and the highest ever realized move was 10.47%. There is a 0.50% higher earnings implied move than the average realized move. This means that there is a 12.4% theoretical edge by selling volatility through the earnings event.
This is also shown in the straddle performance. On average, buying a straddle (buy a call and a put of the same strike and expiration) before the announcement and selling the day after, would have lost 88.22% of your initial investment. That also means that selling a straddle before earnings would have made you 88.22% on average. You can also see the expected IV crush of 10DTE options.
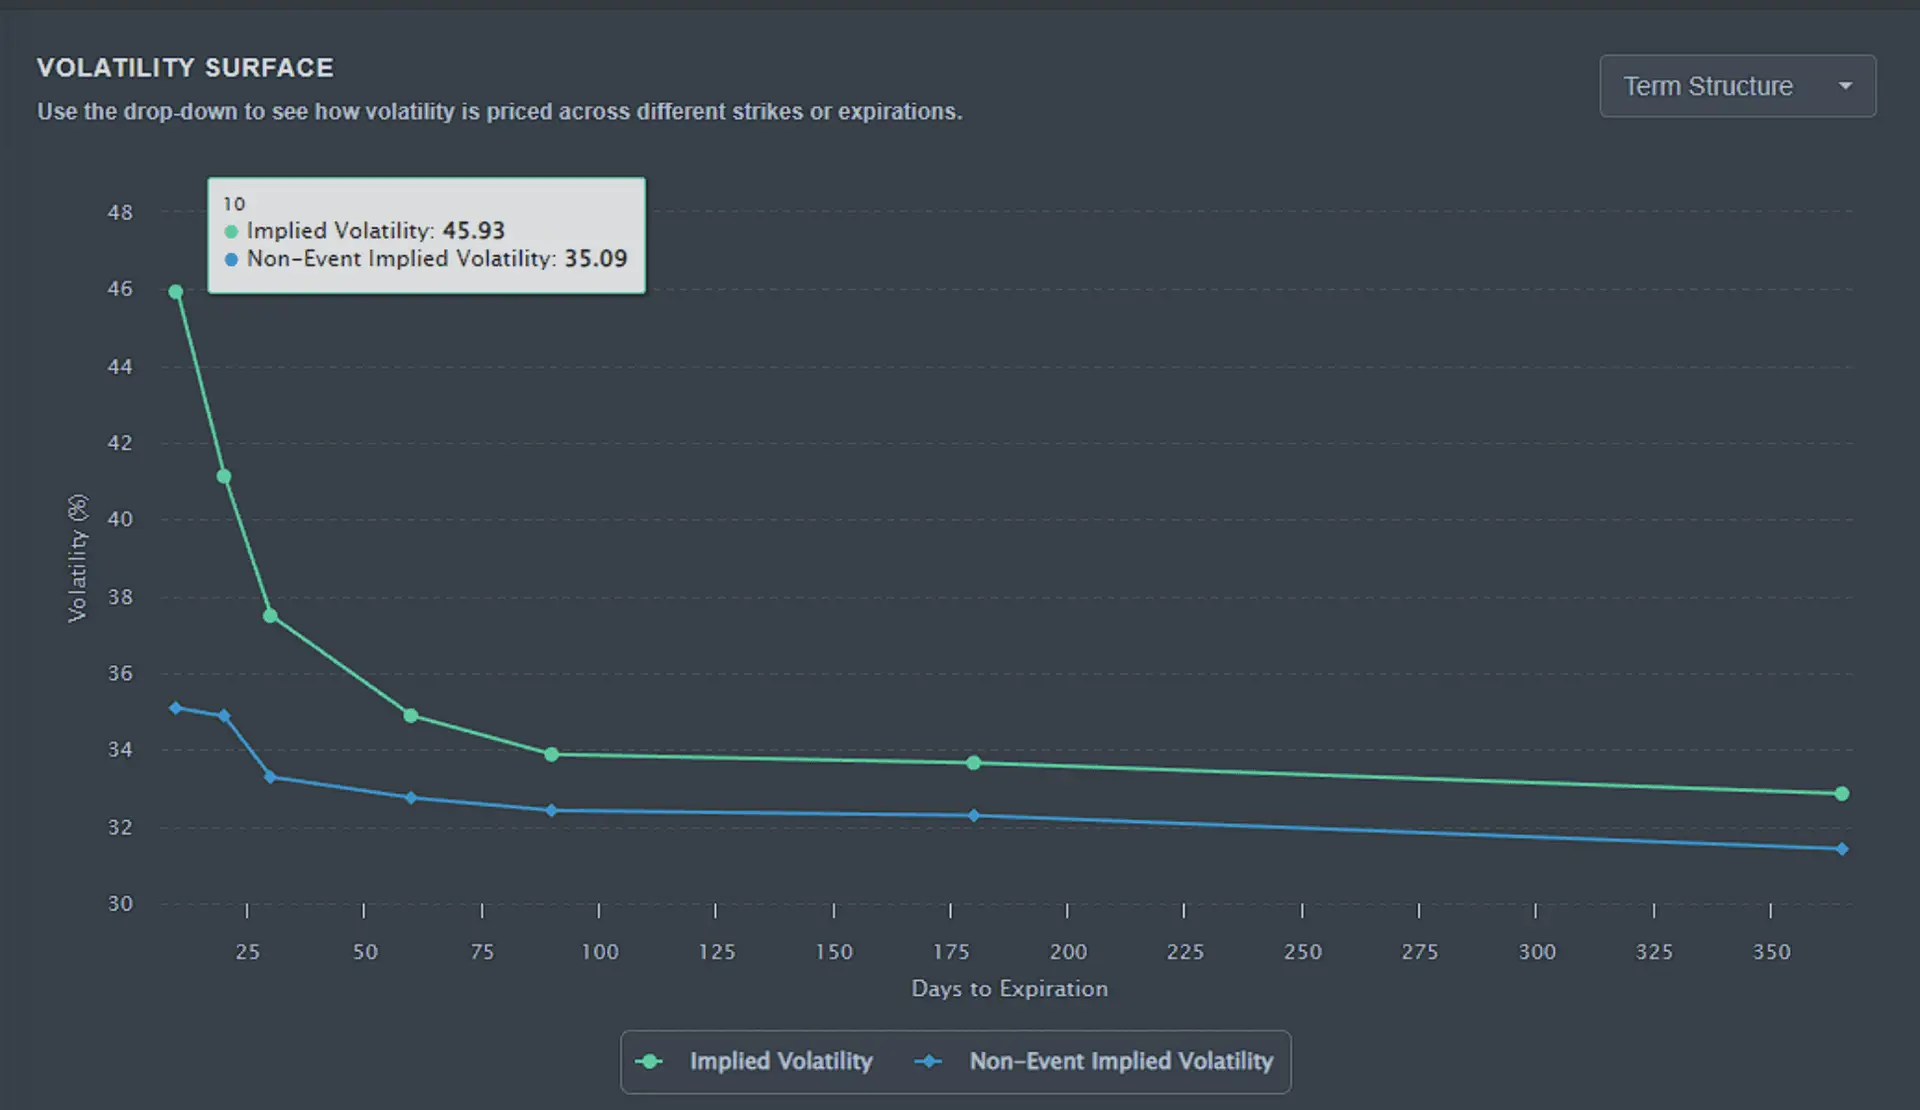
This is calculated by taking the earnings implied volatility and the non-earnings implied volatility and the gap between is the expected IV crush, more on that later.
Apple Backtested Data
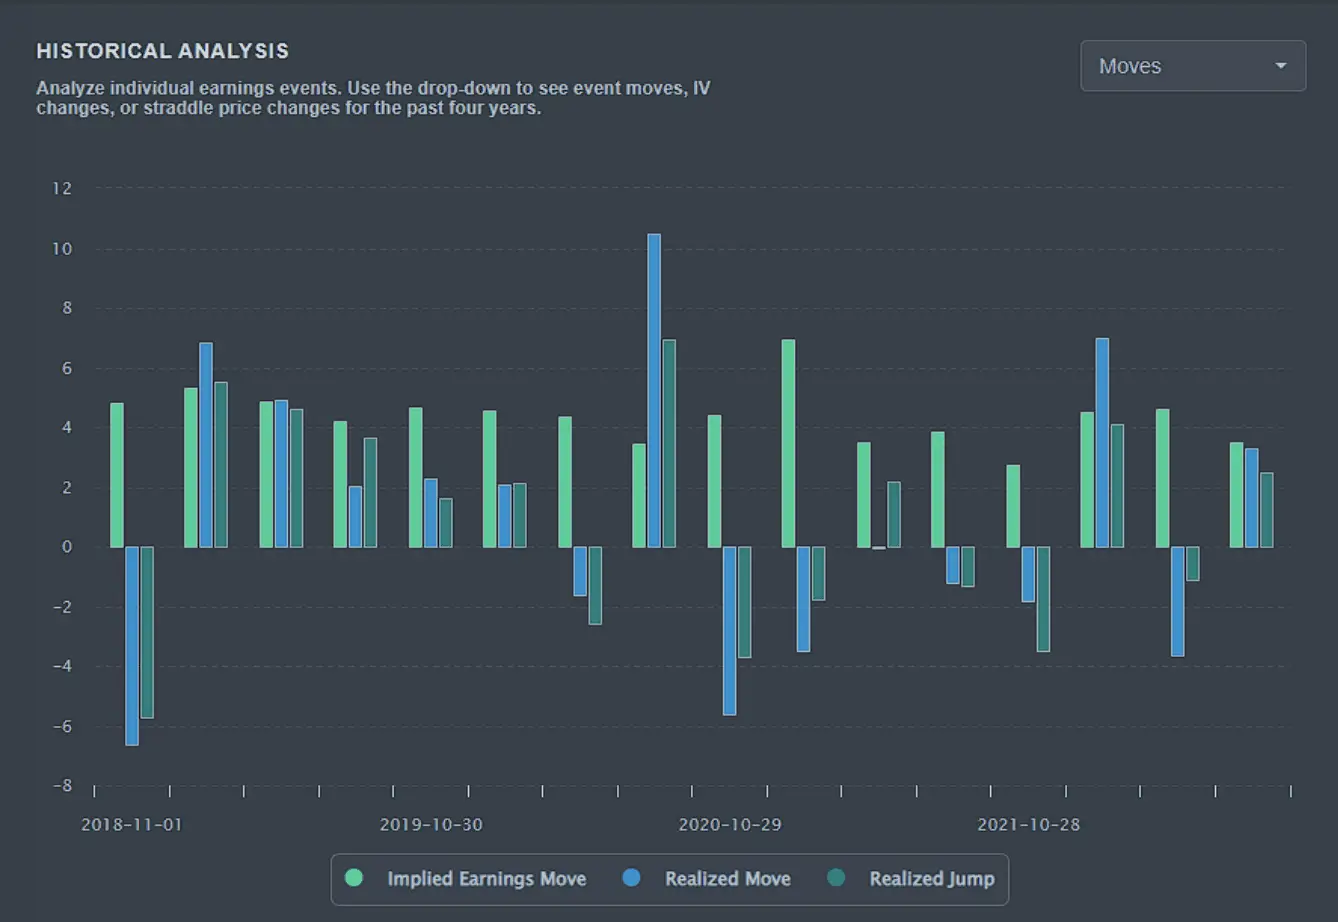
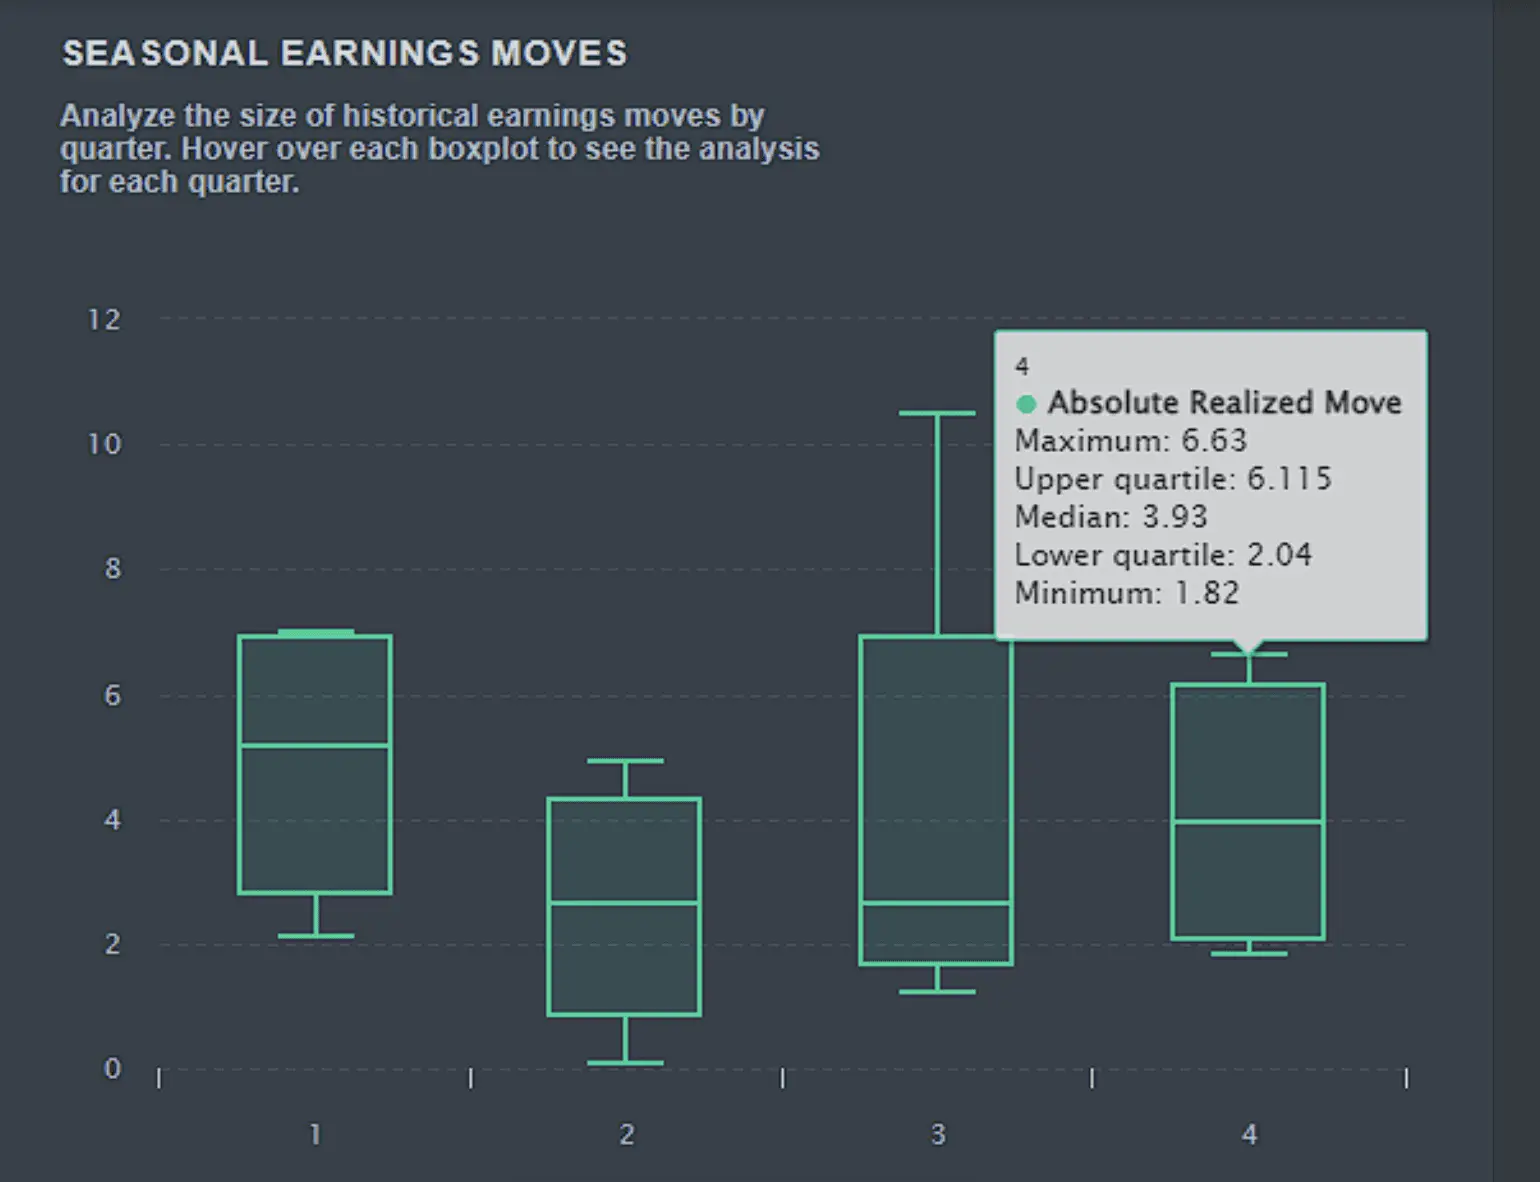
Let’s see how volatility stacks up from previous earnings events over the last 4 years and on a quarterly basis and compare the realized moves. The options market currently prices Apple earnings in line with previous times. On a quarterly basis, the maximum realized move during the Q4 announcement was 6.63%. Apple generally realizes less of a move than the market implies.
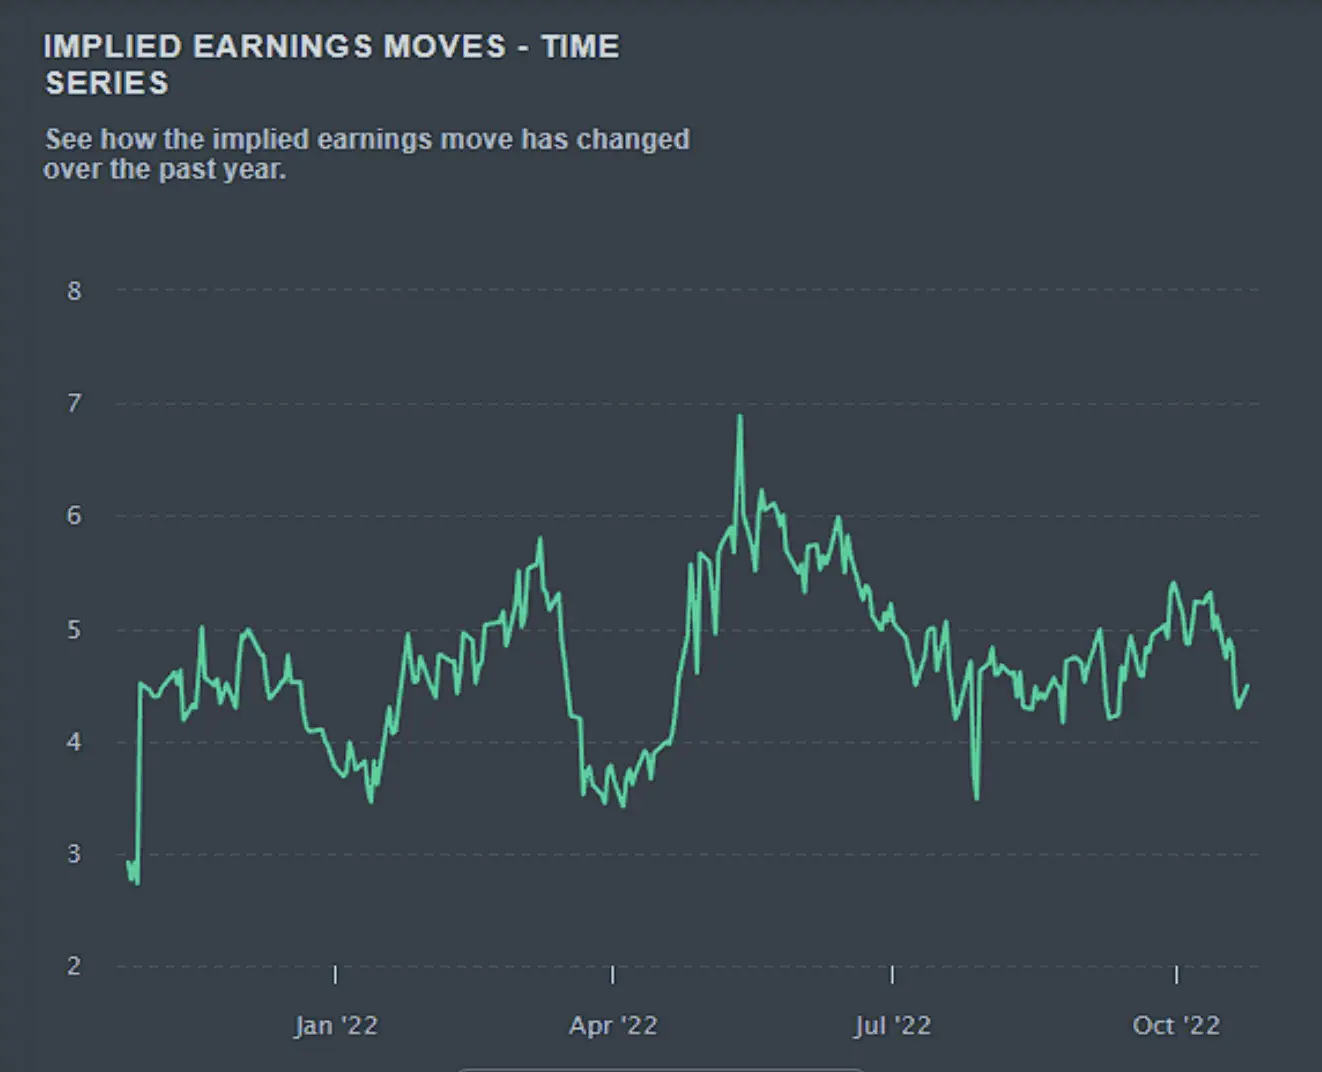
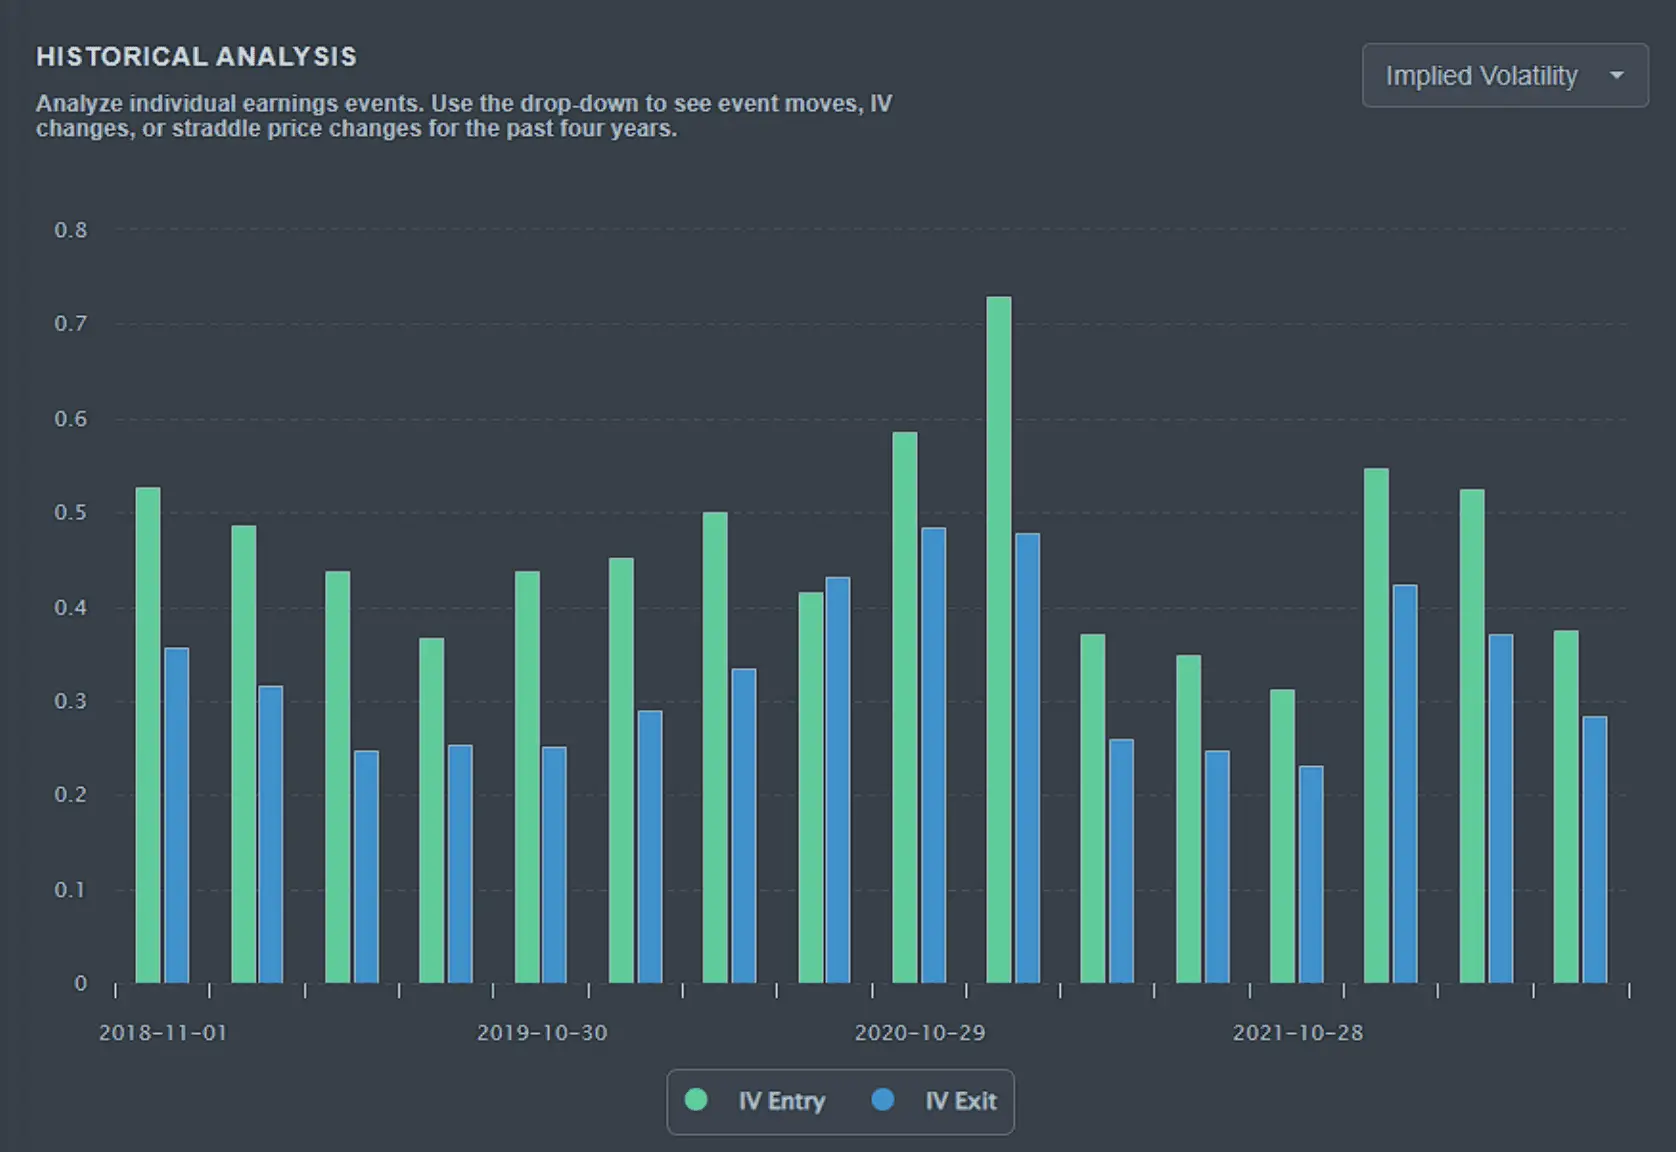
Because the strategy is based on selling premium, we want to backtest how Implied Volatility has changed from pre to post Apple earnings. The chart below illustrates just that. You can see a steady drop off in implied volatility the next day.
Iron Condor Strategy for Earnings
An Iron Condor is a directionally neutral, risk-defined strategy. The goal here is to take advantage and isolate the earnings volatility and capture the most premium while having gamma exposure. You enter the trade with a net credit. Apple reports on Thursday after the close, which means that selling the closest expirations on Friday will end up expiring worthless into the weekend.
This will further help our Iron Condor profit if structured correctly. Why an Iron Condor and not simply sell a straddle? Given Apple’s 7% weighting on the index and the macroeconomic and volatile market backdrop, Apple’s stock price can make higher than anticipated moves. Short straddles carry an unlimited risk, while your Iron Condor strategy has a defined max loss of your short vs long strikes.
You can also roll your strikes and collect more premium if your short strikes are too close to going in the money. Let’s take a look at the volatility associated directly with an Iron Condor and why it would be good to use one for the event. As noted in the graph above, implied volatility drops off post-event, this is how our Iron Condor will make money.
Iron Condor Analysis
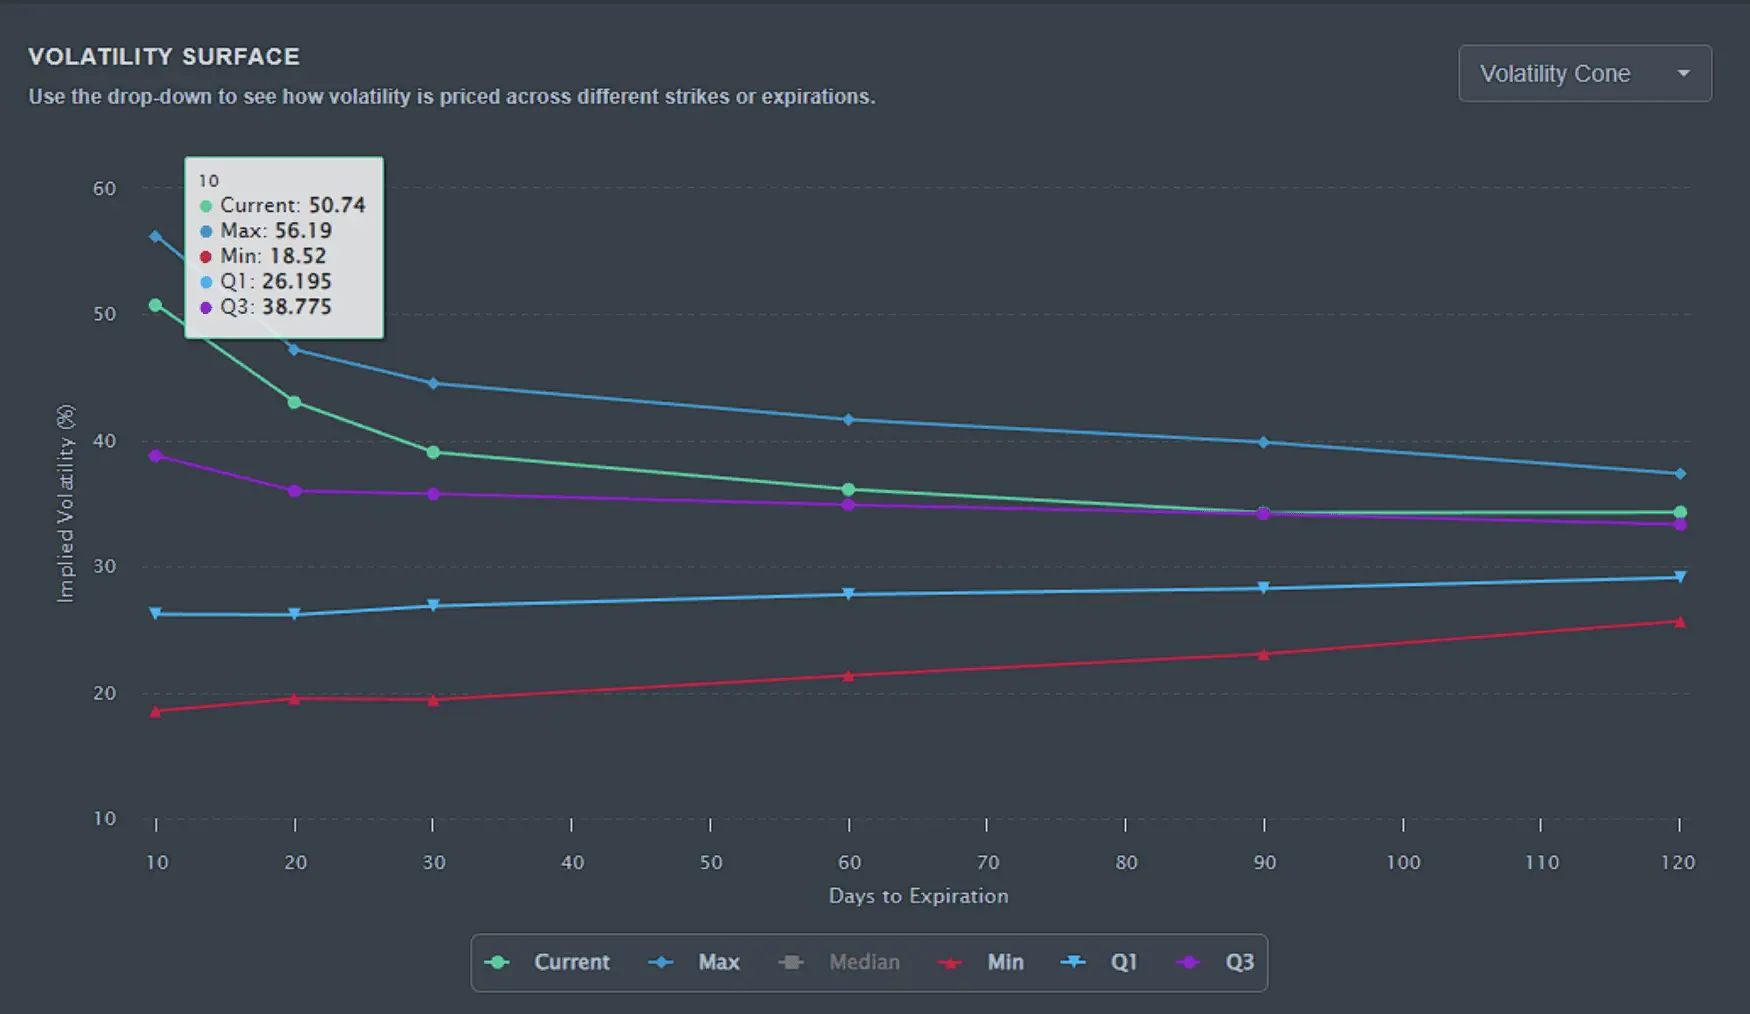
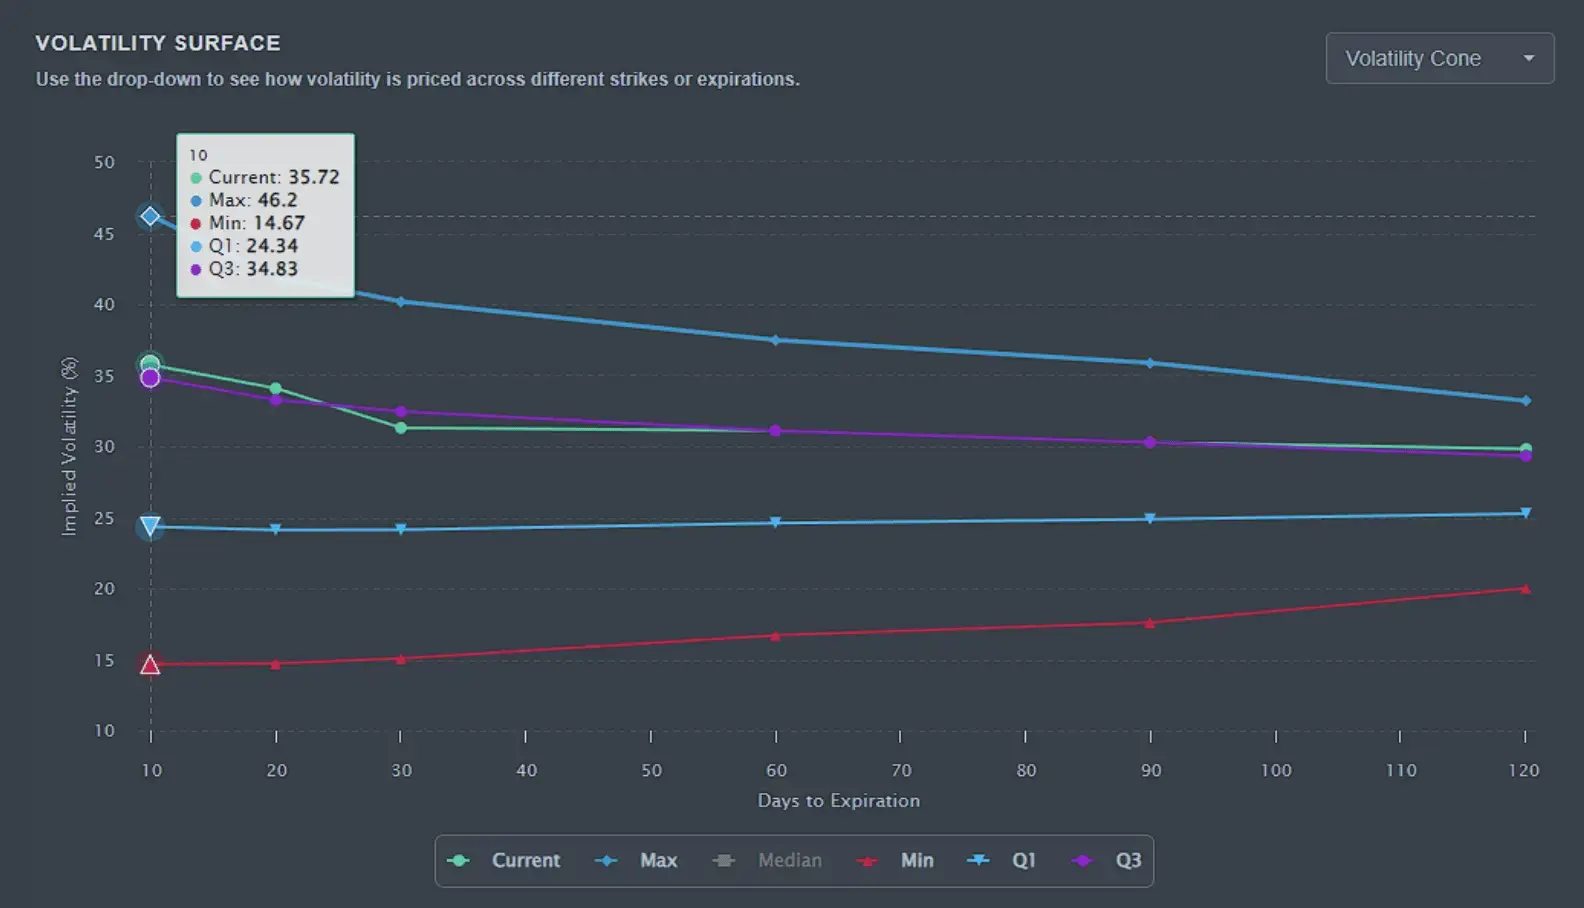
These two charts below are what’s known as the volatility cone and the term structure. Starting with the volatility cone, you have days till expiration on the X axis and implied volatility on the Y axis. This allows us to quickly get a sense of what might be expensive, long, or shorter-dated expirations. It shows the quartiles along with the max and min volatility Apple has seen for that expiration.
Sector Comparison
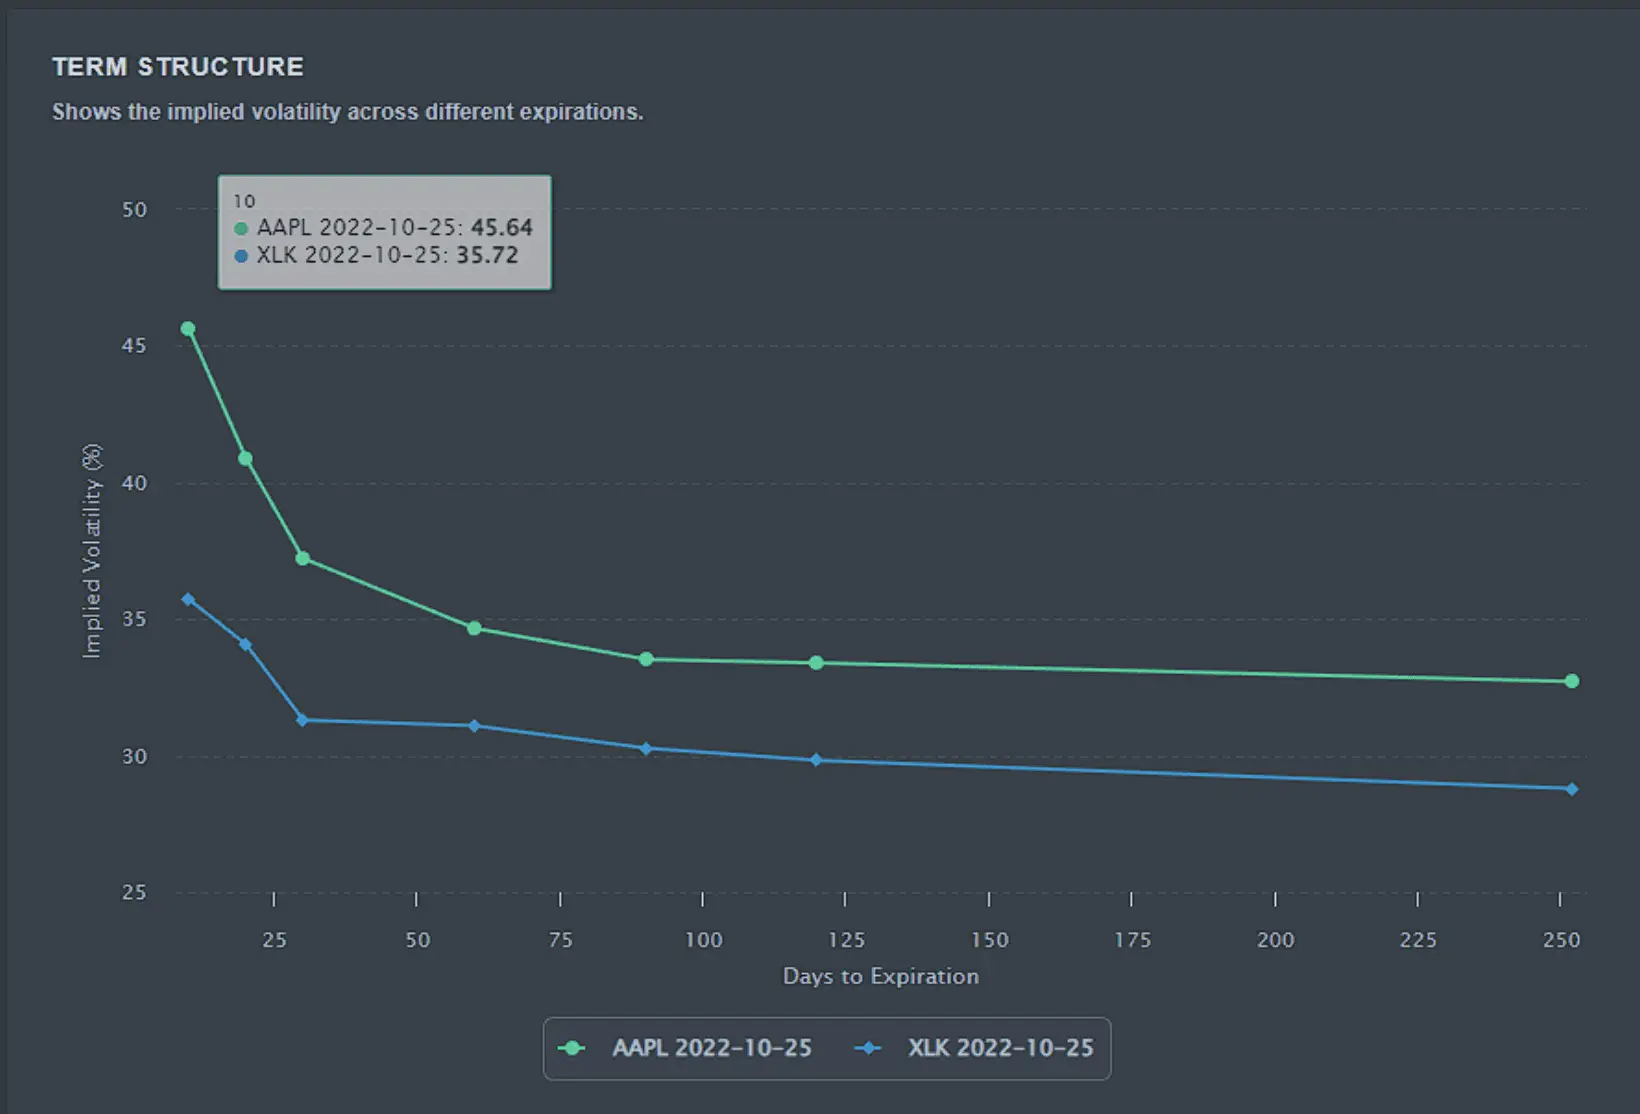
One other thing to look at is the technology sector’s implied volatility and compare that to Apple’s to get a better understanding of the earnings volatility isolation. As you can clearly see from the XLK data and the comparison in term structure, Apple’s implied volatility is elevated above the sector volatility. We can assume that XLK is in the upper 3rd quartile of IV, given that MSFT, GOOG, and META, all report earnings this week.
Calendar Spread for Apple Earnings
A calendar spread is also a risk-defined, directionally neutral strategy. It can also be structured with a bullish or bearish bias depending on the strikes chosen. It profits from the passage of time and an increase in volatility in the back-month option. The trade is structured by selling a close-dated call or put and buying a call or put of the same strike in further dated expiration.
You enter the trade with a net debit instead of a credit, unlike the Iron Condor strategy. Calendar spreads are much better for margin requirements and efficiency. The goal here is to allow your short strike to be eaten up by theta and your long strike to gain volatility expansion and gamma exposure. I should mention the greeks for you as a refresher. Long calendar spreads have positive theta and positive vega.
Because the options market has one day to react to Apple’s earnings, I would expect that the back-month option would see a slight increase in volatility expansion over time, helping our long option, as the shorter-dated option will lose more value. Simple terms, you want the shorter dated strike that you sold to lose more value than the longer dated option you bought.
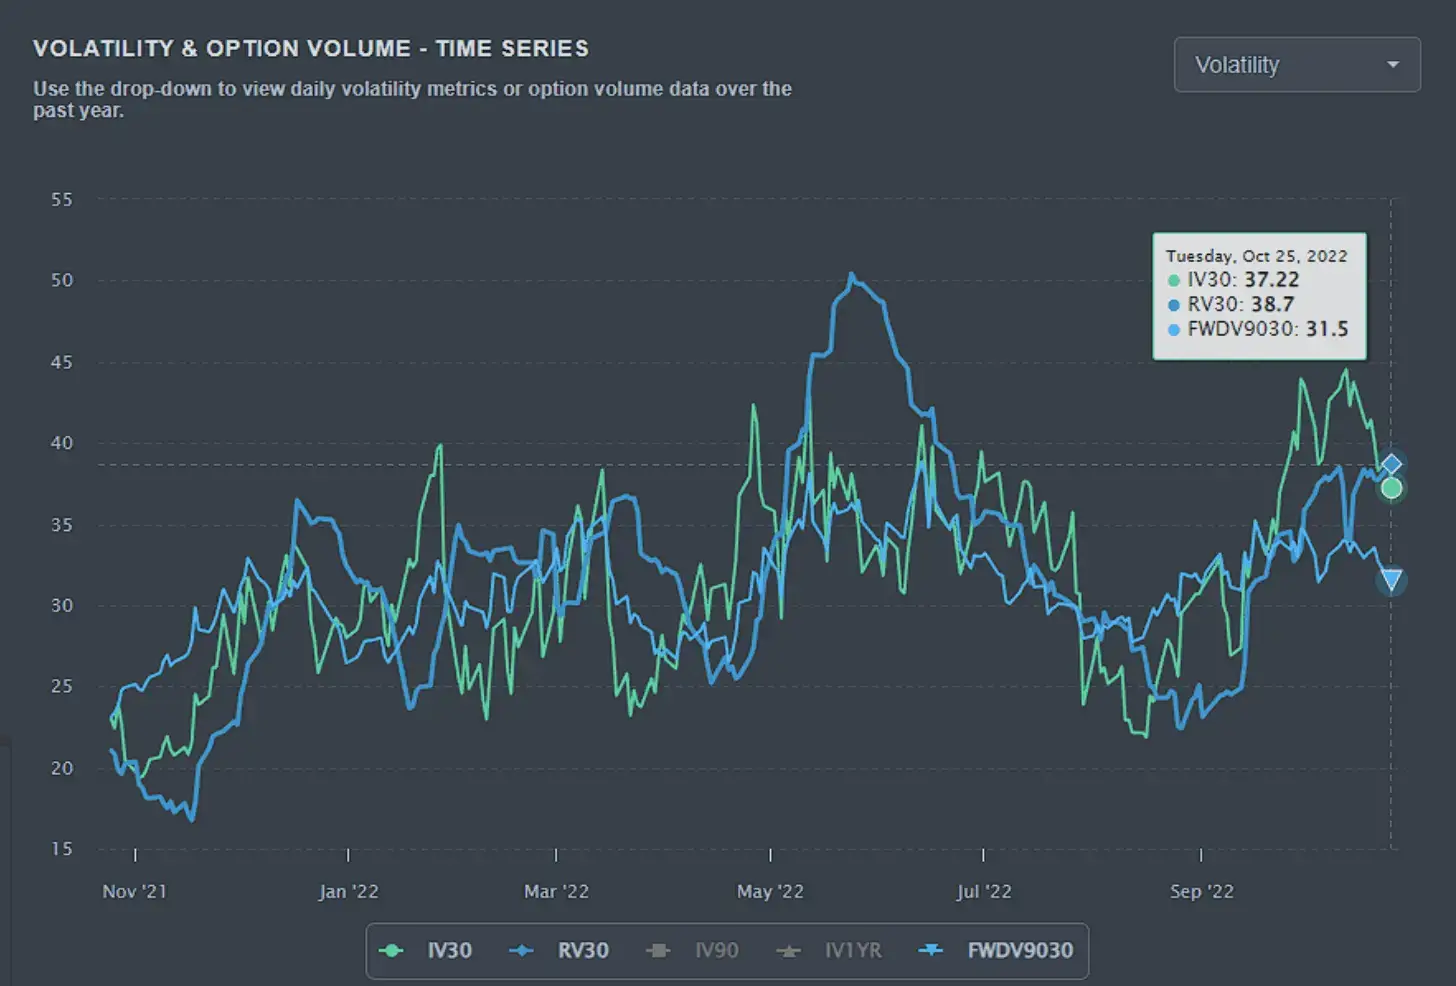
Let’s see the data backing this up. If you review the term structure chart, you will see a significant drop off in volatility as expirations get longer. The chart below is a 1-year graph of Apple’s IV/30, RV/30, and FWDVOL90/30. This clearly illustrates that IV over the 30-day period is much higher than the forward volatility that the market anticipates.
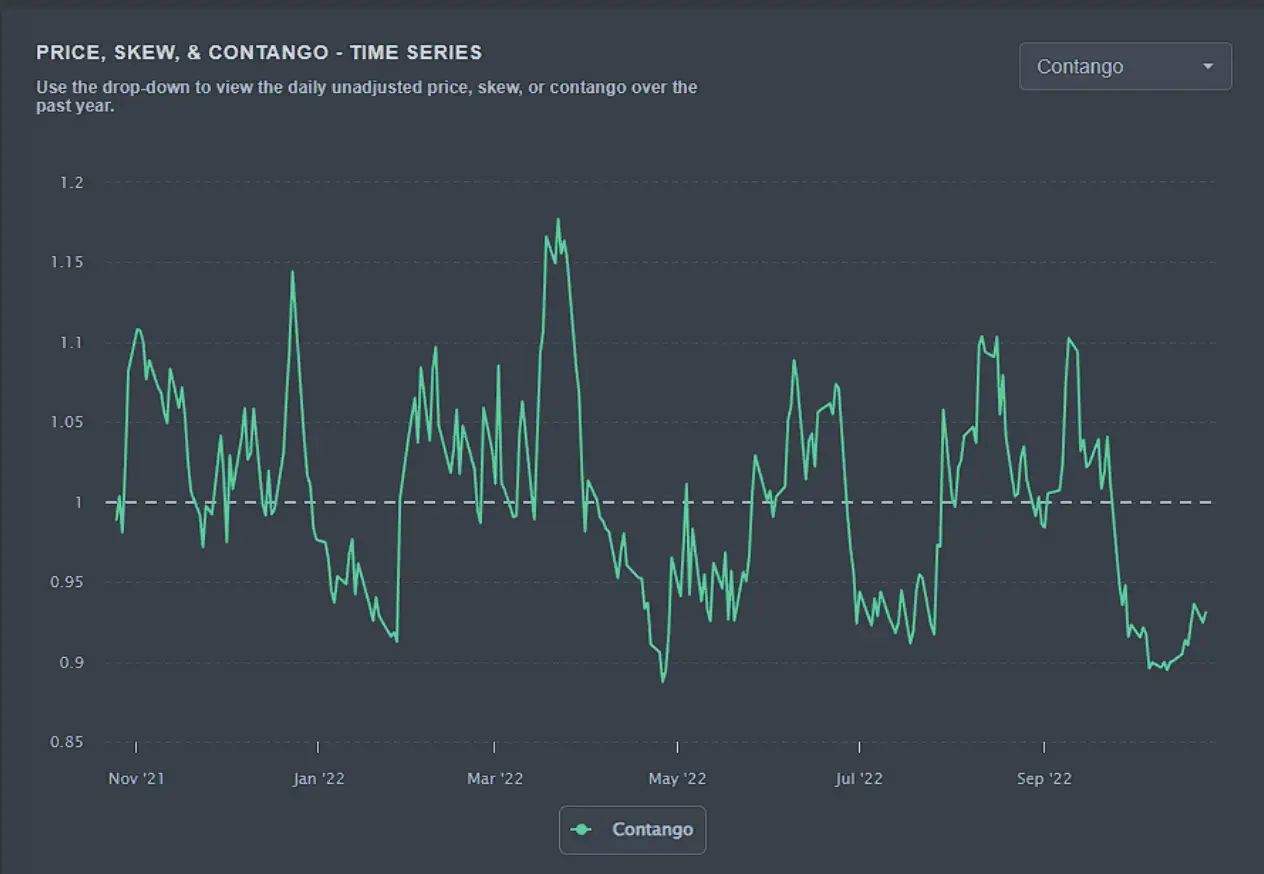
The second chart is what’s called contango. In simple terms, the higher the contango number, the more expensive further dated expirations are. You can clearly see here that further-dated options on Apple are more inexpensive as related to the closer-dated options. They tend to spike when at these levels.
Options Skew Structure Analysis
One of the more important graphs to analyze is the skew structure. This is the root of all options. What we have here is implied volatility across 30, 60, 90 day expirations on the chain. This allows us to get a better understanding of the more likely outcome, and where the options market is pricing the risk to be.
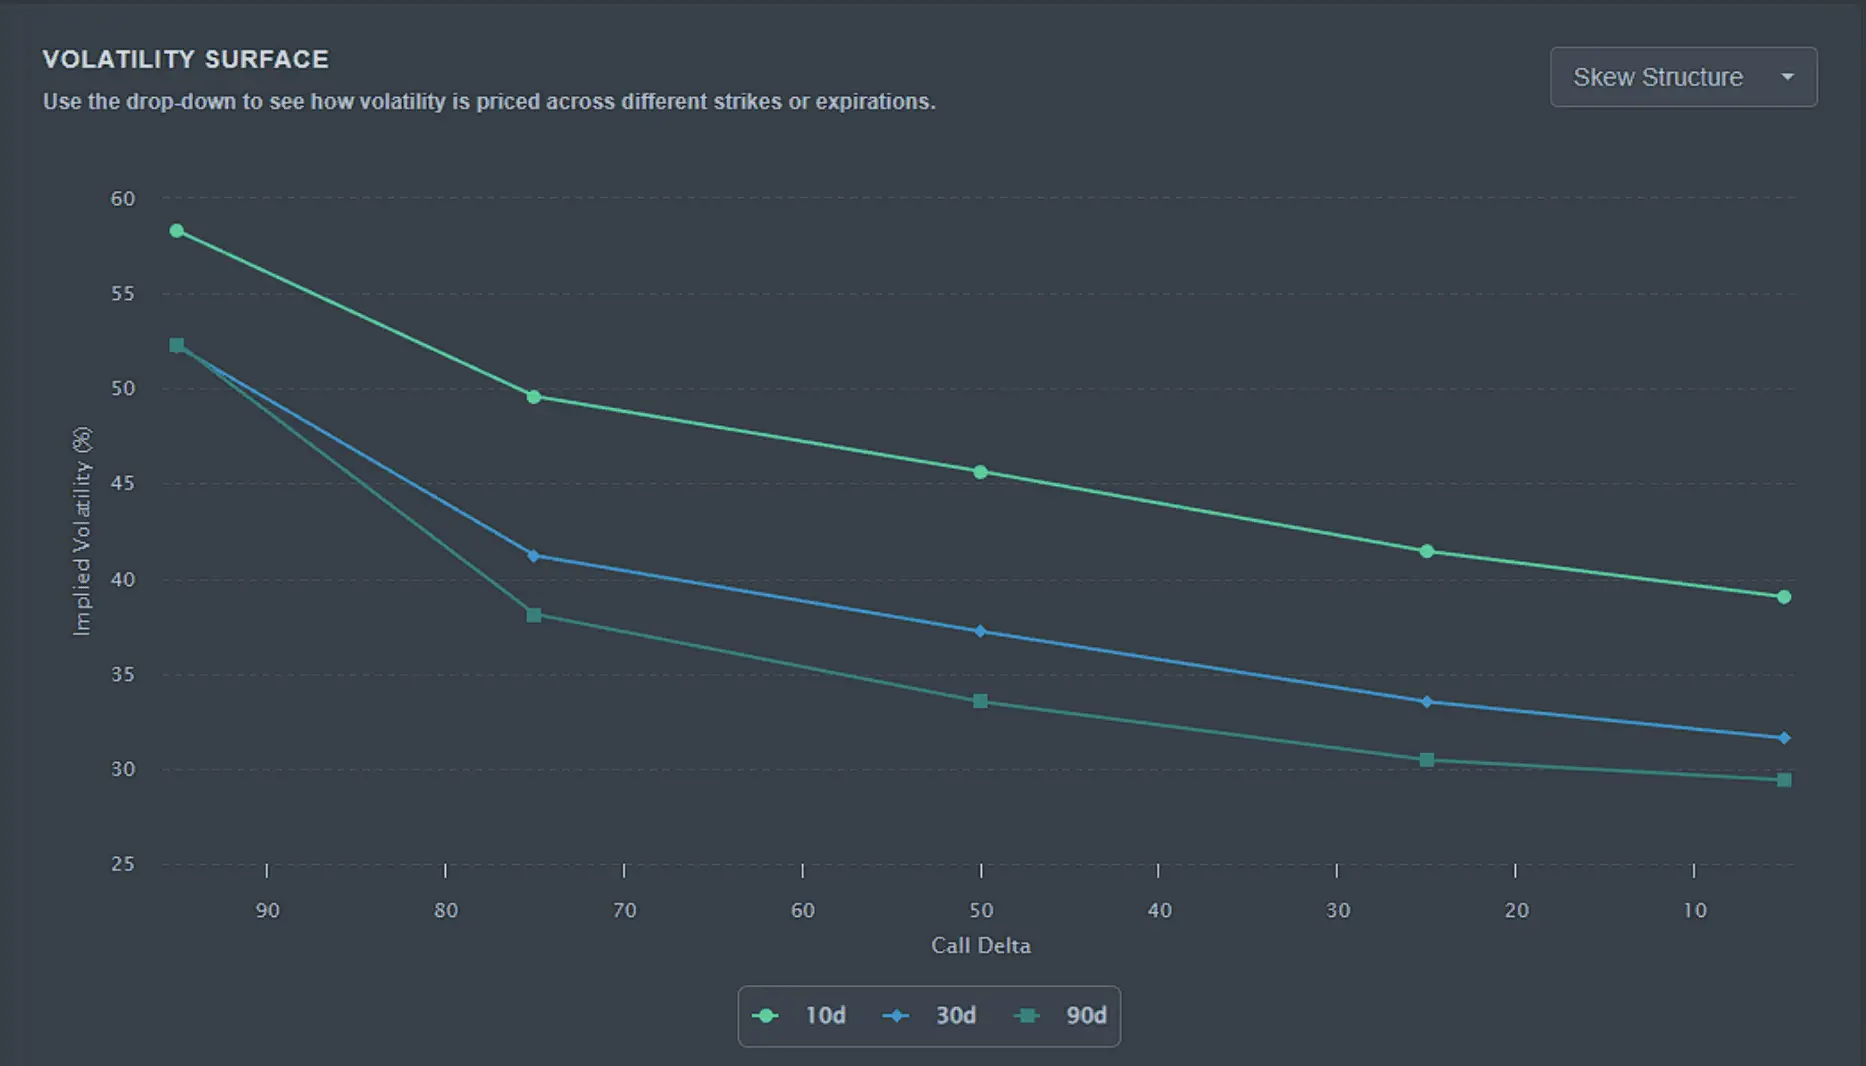
This is expressed in the call delta on the x-axis. The left two dots here are out of the money puts (90 call delta), the center dot is at the money (50 call delta), and the right two dots are out of the money calls (10 call delta). You can see that the out of the money puts are priced much higher than the out of the money calls across all expirations.
Traders will be able to take advantage of the difference in pricing. This is because the most likely move would be to the upside and the risk is being priced to the downside. If the downside prevails after the earnings report, Apple’s stock will move with much greater force than the upside.
Using Order Flow for Apple Earnings Analysis
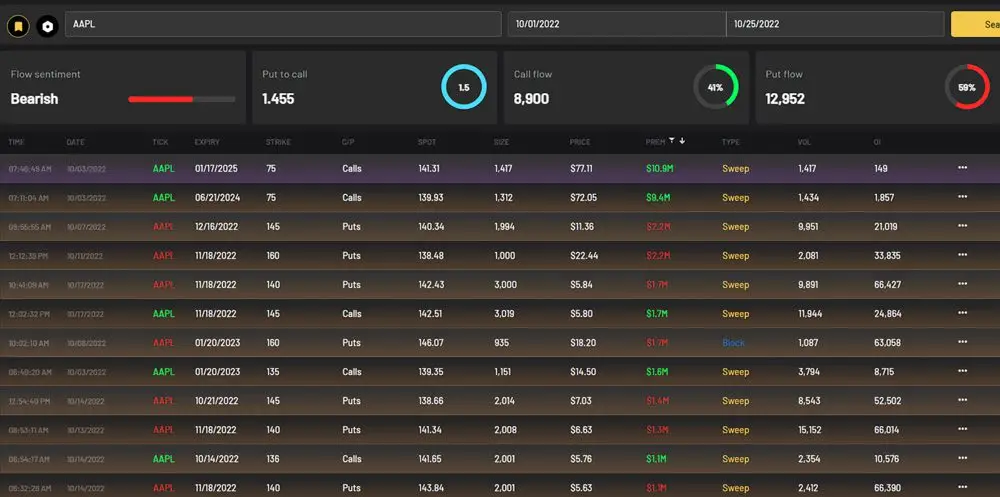
With flow data, we can get an understanding of where larger market participants are placing themselves for the earnings announcement. Sorted by over $1M in premium and above ask, this is what we can get in terms of order flow from October 1st. A little bit mixed in terms of the larger order flow.
Apple Earnings Analysis with Dark Pool Data
Dark pool level data can be used as support and resistance when doing technical analysis. We like to use dark pool levels in sync with technical analysis to determine where potential breakout points might be. Let’s view the largest prints in recent times to get a good understanding of where large market participants have been buying and selling.
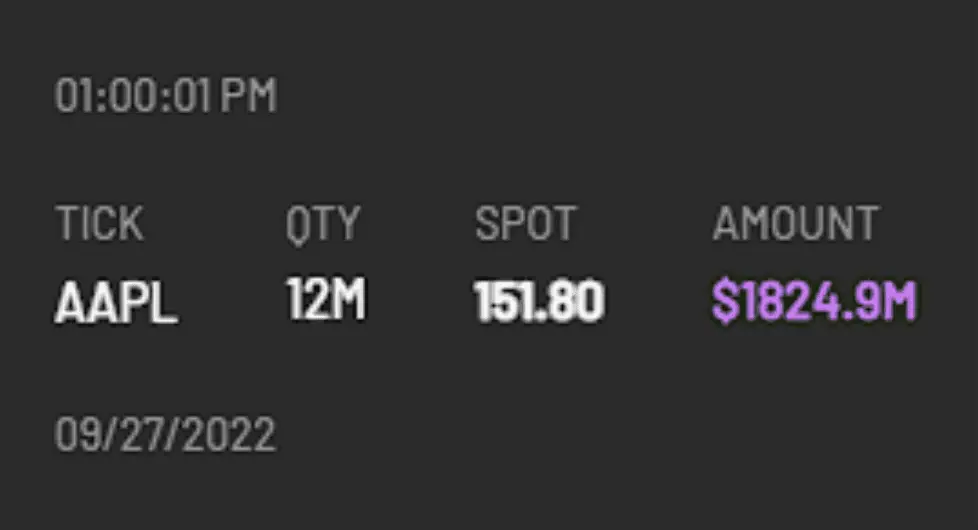
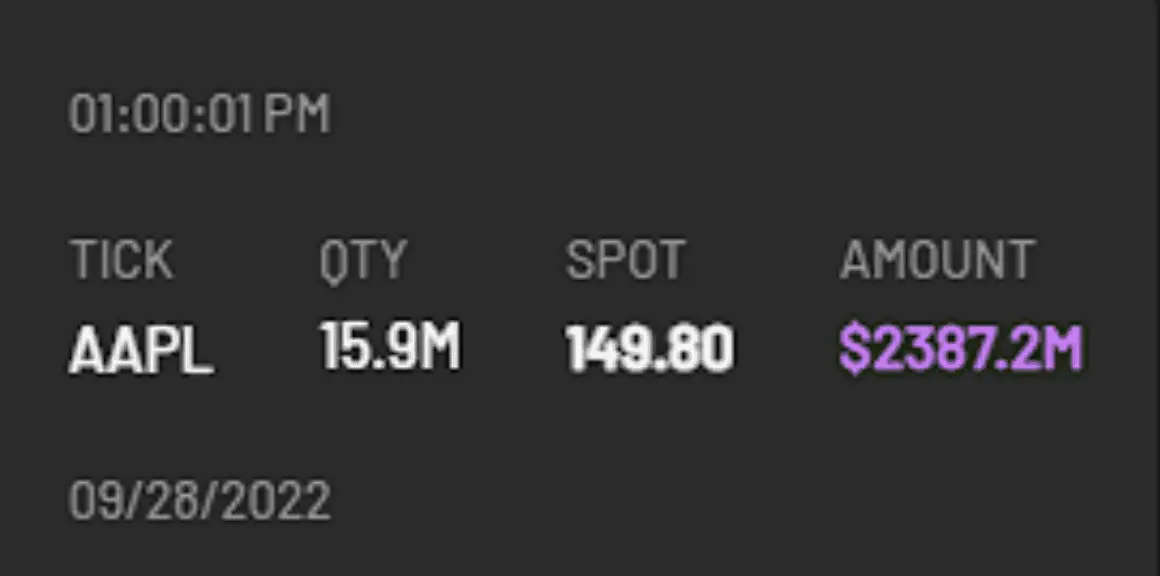
On 9/27, Apple saw a $1.8 billion dollar print at $151.80 per share. The very next day on 9/28, a $2.3 billion print came through at $149.80 a share. On 10/21 Apple saw about $850 million in dark pool shares be traded in the range of $142-145. Looking at Apple’s stock chart at the top, you can see that we have been relatively range bound from about $135-150 a share.
Closing Thoughts
Given the production cuts and macroeconomic headwinds from the strength of DXY, It would be challenging to say that Apple has a blowout quarter. This isn’t to say that Apple has had recent earnings revisions and anything “in line” with the street can send the stock higher due to “better than feared” earnings.
The street expects revenue of $88.79 Billion and EPS of 1.27. But given how volatile the overall market is, We would recommend spacing your strikes out enough to be within the relative stock price range, but close enough to capture the premium.
Your long strikes will allow exposure to the underlining through gamma. As a reminder, to capture the most volatility premium, it is best to open these trades the day of the announcement after you decide which strategy works better for your outlook and risk strategy. You can calculate the expected outcome through your favorite options profit calculator and use the expected IV crush I mentioned above.
This earnings report is one of the most important in recent time and will further drive the directional bias of the markets for the next couple of months. There will be high anticipation and high expectations. I hope this helped you either form a trade or learn some important insights.
Charts provided by PredictingAlpha. Disclaimer: Cheddar Flow is not a registered investment advisor nor is licensed as such with any federal or state regulatory agency. Cheddar Flow does not manage client assets in any way. Information provided and opinions expressed on this website do not constitute investment advise. The ideas expressed on this site and related services are solely the opinions of Cheddar Flow and are for educational purposes only. We advise everyone to know the risks involved with trading stocks and options. We encourage every visitor to the website to do his/her own research and to consult with his/her own financial advisor(s) prior to engaging in any investing activities, and to make sure he/she knows all the potential risks involved. Any investment decision that results in losses or gains made based on any information on this site or related services is not the responsibility of Cheddar Flow. Cheddar Flow is solely a data-provider and not a stock picks alert service.