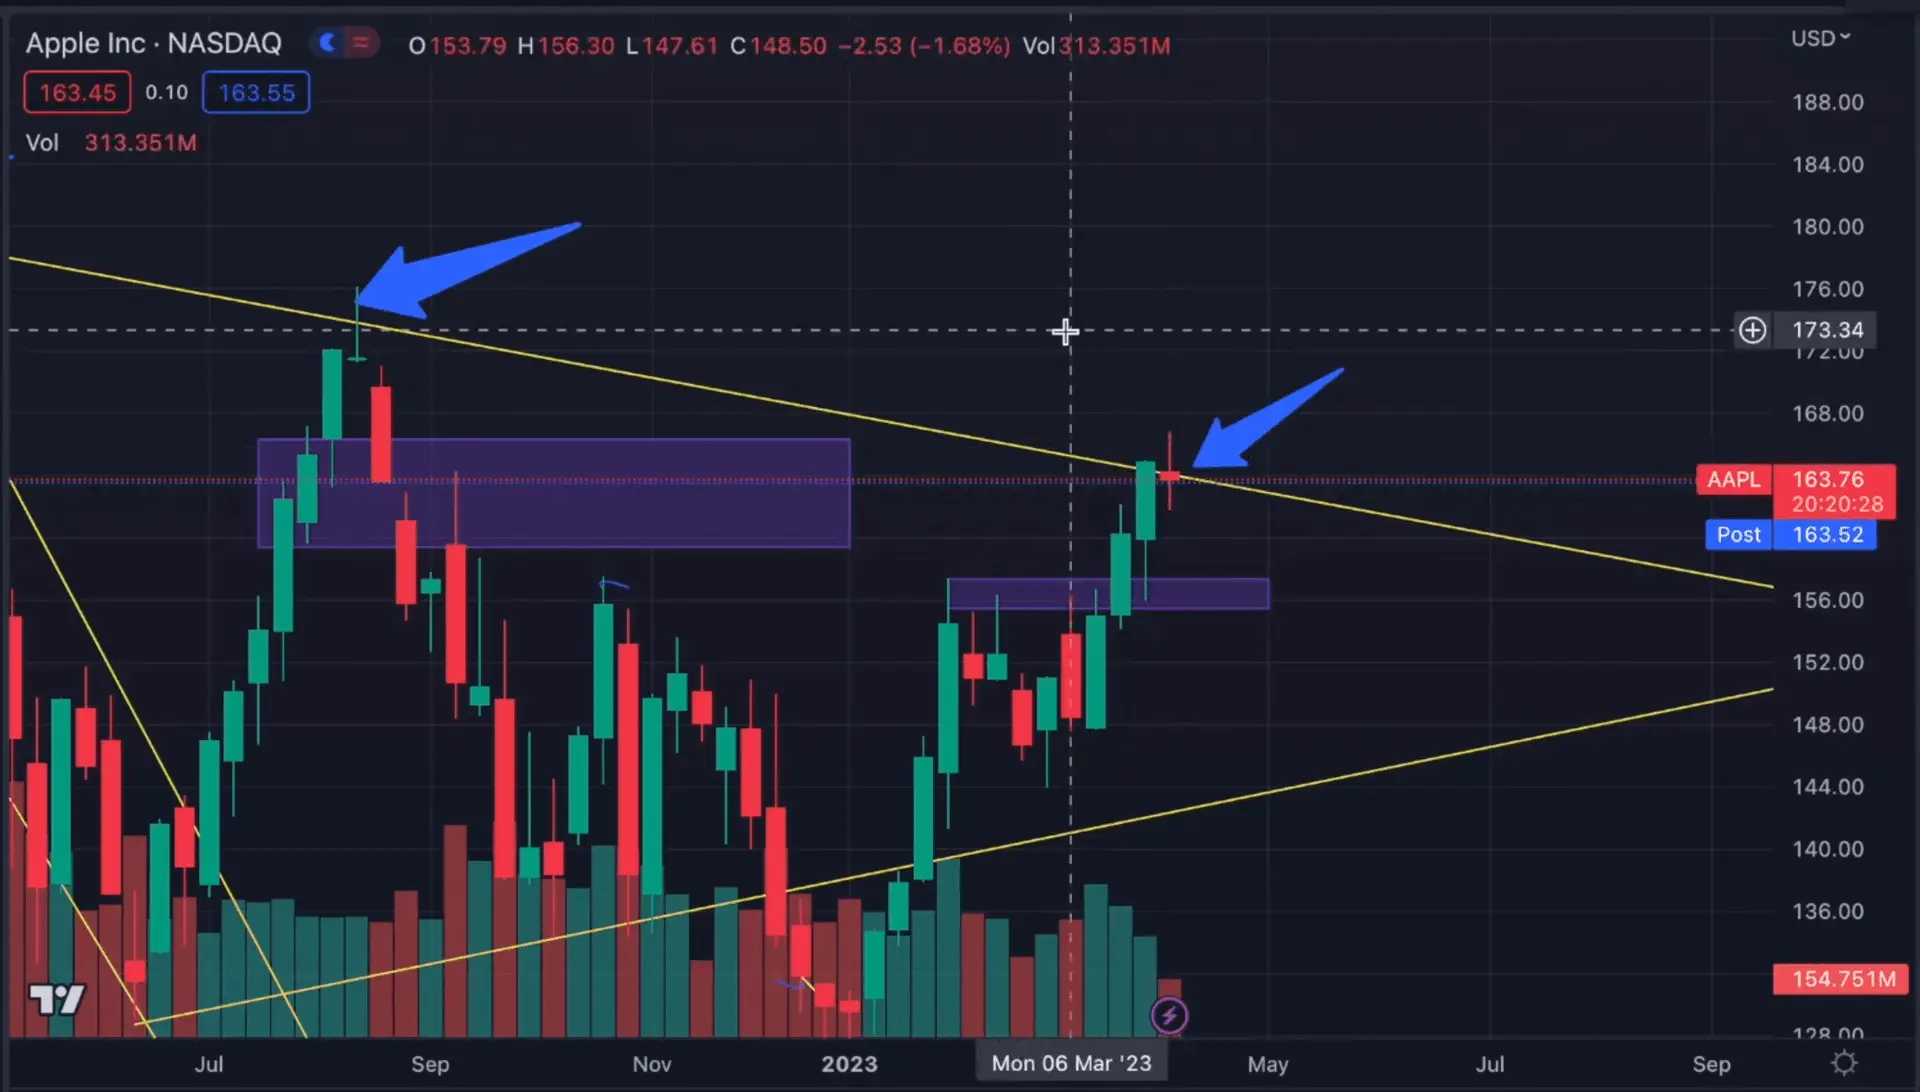
A critical trend line in Apple’s daily chart is currently a hard resistance level, according to our technical analysis. This same trend line has caused significant self pressure in the past, with three key rejections, leading to a sell-off to new lows. Despite Apple’s current position, it does not necessarily mean that the company will go back to new lows. However, its historical price action has indicated that it tends to have a hard rejection followed by downside momentum. Thus, it’s essential to pay attention to where the weekly candle closes on Thursday, especially if it is below this line.
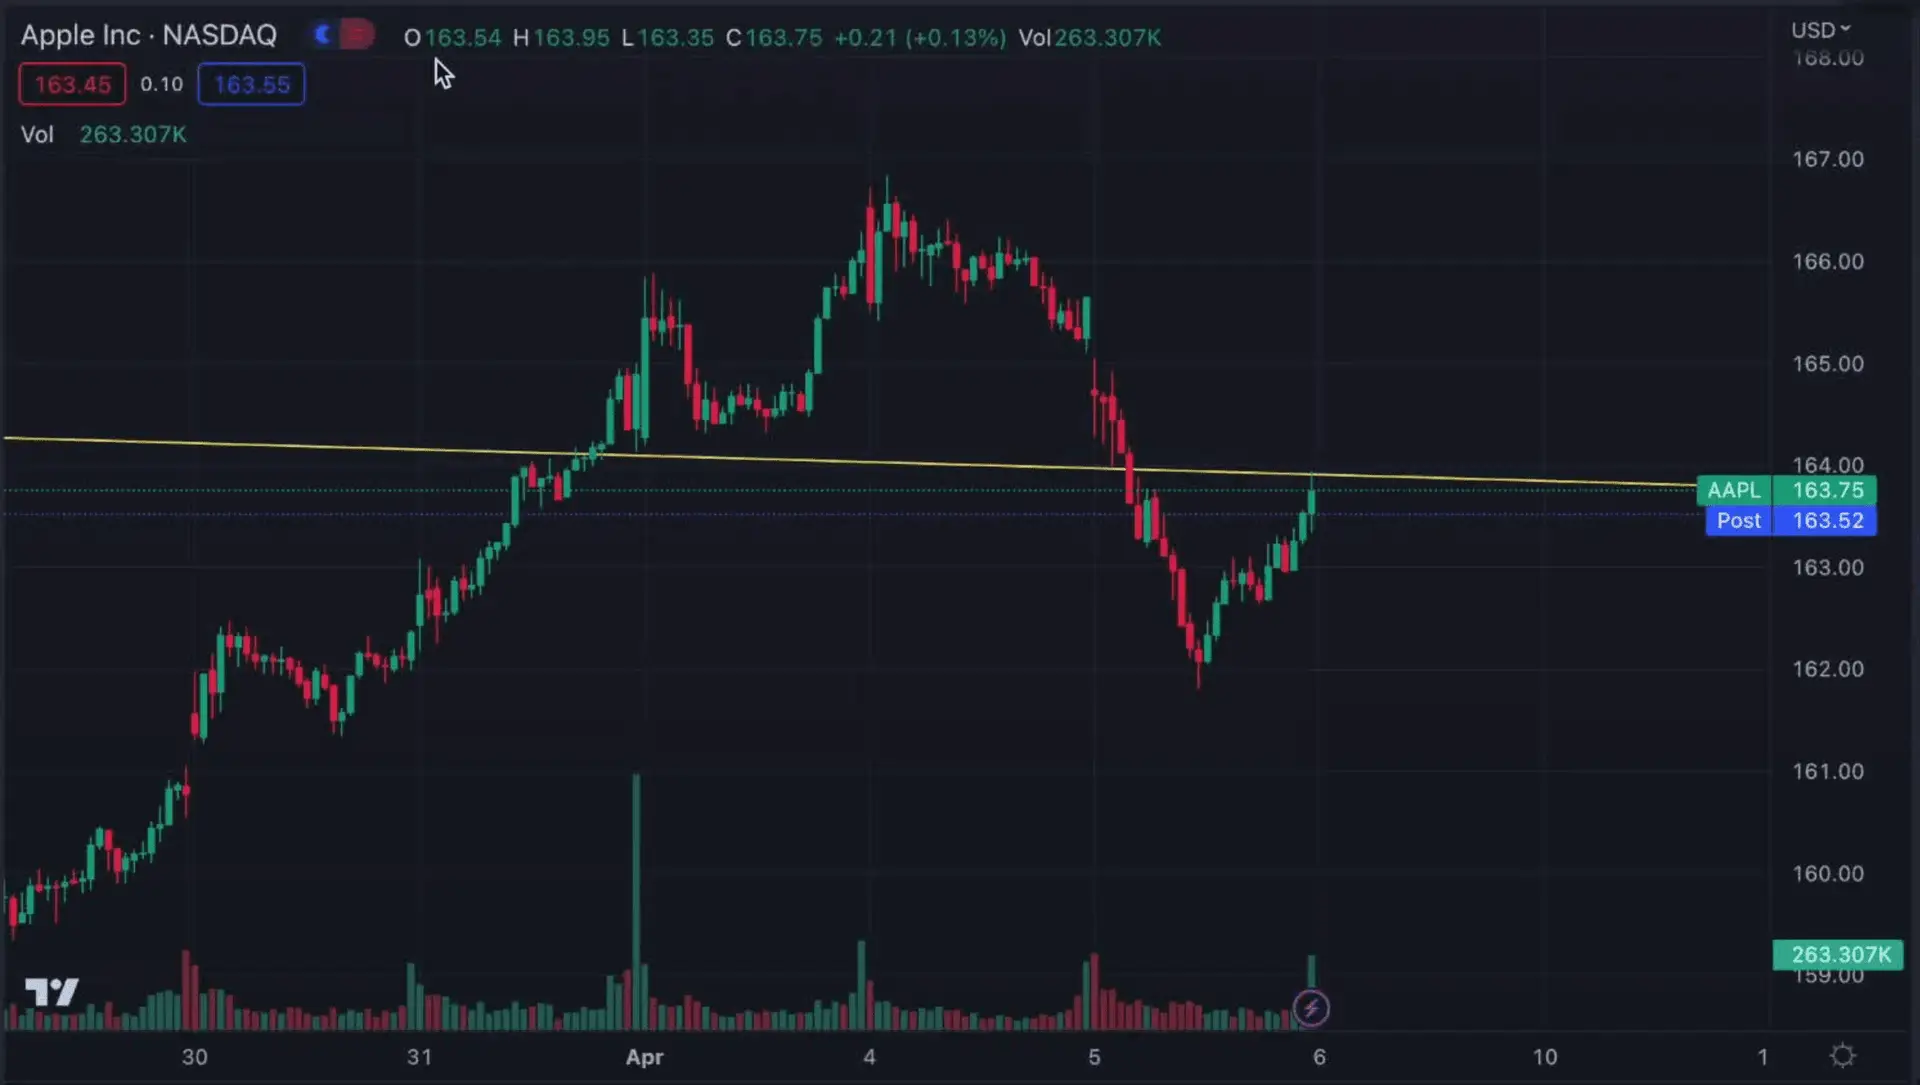
If Apple’s weekly candle closes below the trend line, it could be an early indication of a potential rejection off this level. At around $164, the risk reward is favorable to the short side as this same trend line has prompted a lot of self pressure in the past. Technical analysts are looking for some form of confirmation on the weekly candle to show that it is printing below the trend line.
Apple’s price action is critical, as it is the largest weighting of both the S&P 500 and the NASDAQ. Our technical analysis expects that if Apple does sell-off, it could lead to more downside for the overall market. The current trend line is the same line that Apple had a hard rejection from back in August 2021. Although the rejection does not necessarily mean that Apple will make a new low, a hard rejection from this level is expected.