As chartists delve deeper and into their trade, they experiment with various types of lines. Some are fibonacci lines, trend lines, or even more complex spirals and sine waves. There are many ways to make use of these lines but the most powerful type as agreed upon throughout all markets is support and resistance levels. If you’ve ever wondered why a stock broke up or broke down from some particular level it likely has something to do with these invisible lines. These lines remain invisible until you draw them out ahead of time and start to see how price interacts with them.
Support and Resistance Levels
These horizontal price levels either become the new breakout point, or a place for price to fall and consolidate before trying again. A resistance level can quickly become support (an S/R flip) if price breaks through it and successfully holds, the can continue higher.
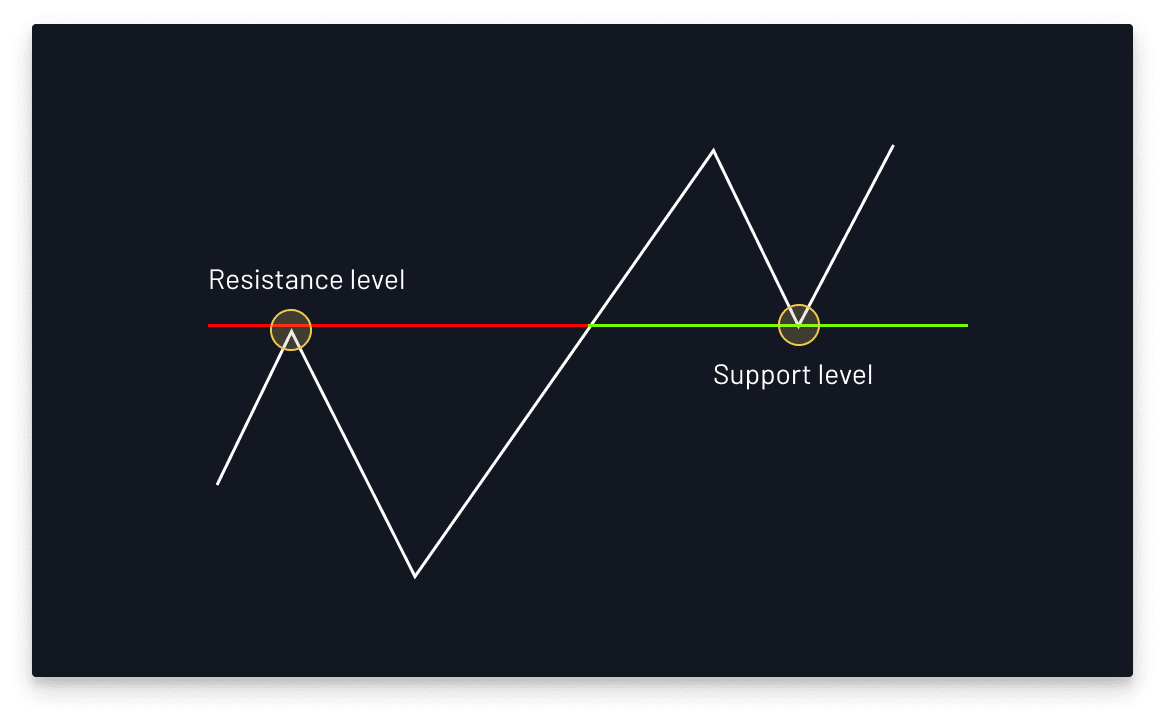
So what is the best way to make use of these levels? Well, step one is identify them. This is most easily done on macro charts (one day and higher). Take note of a place that price stopped then fell, or broke through. You can then begin to see flat spaces on a chart that price interacts with.
Square
Square (SQ) has been bleeding out for a while with some isolated pumps and dumps as the market figures out what direction to take. But it has for the last 6 months been obeying a crucial support level. Every time Square tests these levels, call or put volume shows up to grant confluence to the idea.
Late December on the last trading days of the year, call flow for Square (SQ) started showing up at a crucial level. This test of support became an S/R flip. Support or resistance levels were able to hold after breaking through and successfully retesting this area. Square’s stock gapped up strongly that week yielding call holders large profits.
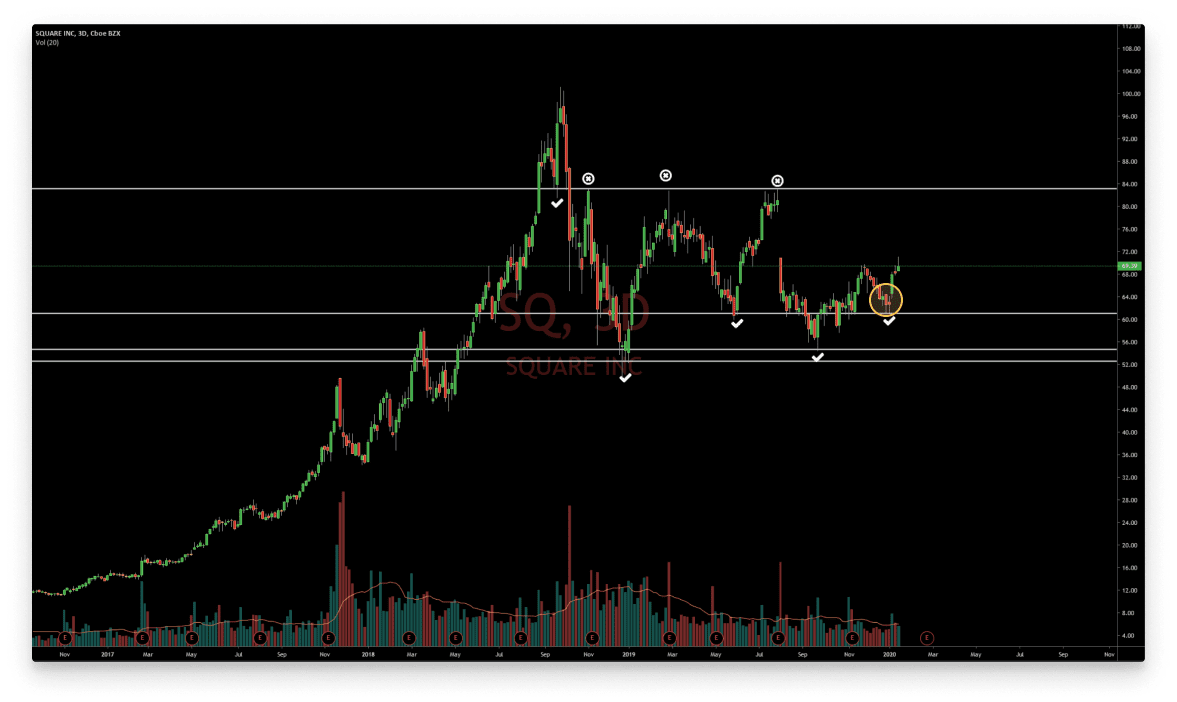

Positioning yourself on these crucial levels is one way how big money is made trading. The easiest way to identify these levels, especially on messy charts like Square (S)Q is to move up to the 3D and weekly time frames. This will allow you to see where the levels are and map them out with horizontal lines. Leave these long term lines on your charts because you never know where they will pop up. The older the support or resistance is, the more powerful it becomes.
Canopy Growth
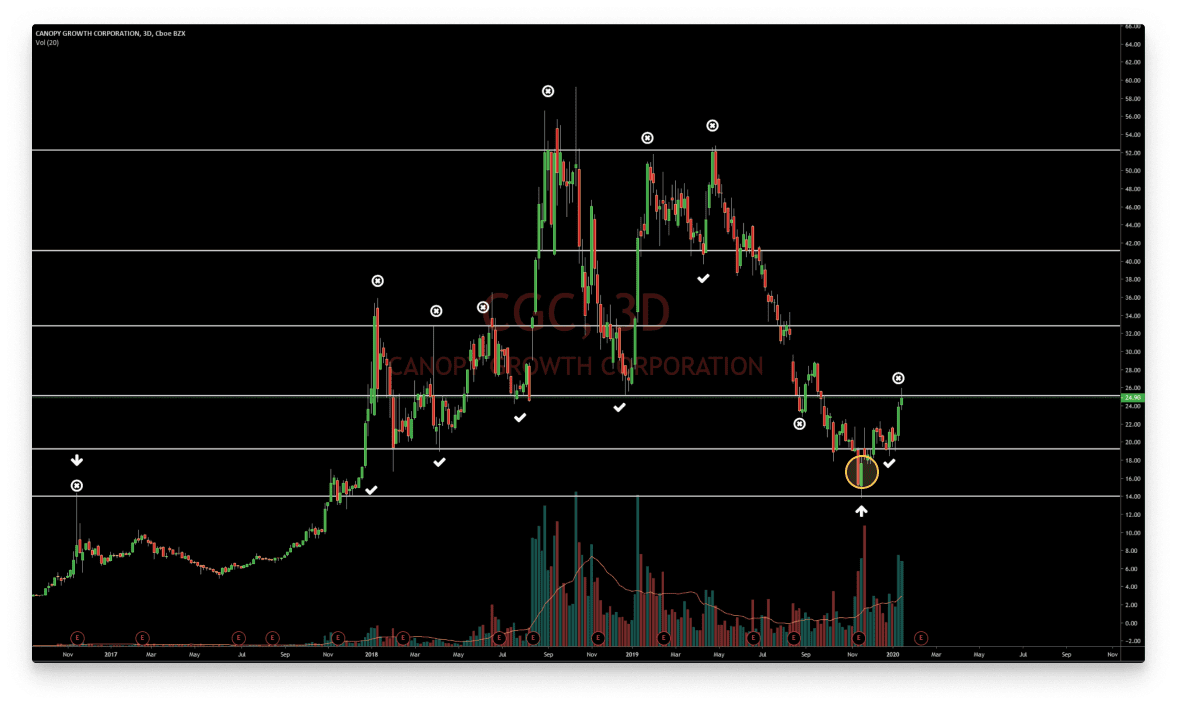
Canopy Growth (CGC) is a very popular marijuana stock despite bleeding out for a year now. Many who bought it at the top have been paying for it.
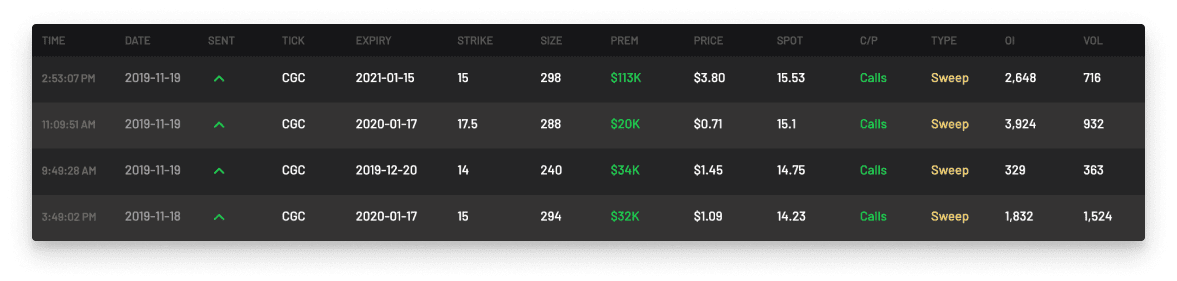
However, it finally found what seems to be a bottom at a crucial area in November. Call buyers bought blood as CGC came down to test it’s oldest support. When a prior resistance turns into support then you are likely to see a bounce. CGC did and went on to rally to $21 from the low that week.
Final Thoughts
My advice to you as a trader is to spend time plotting out your support and resistance levels. Many of you already know the basics of this methodology. When your favorite stock hits a level you marked out weeks ago and you have counter trend option flow, it’s time to pay attention. Horizontal lines tend to work better than trend lines when it comes to support and resistance and I suggest you plot some of these out on your favorite chart. They exist on all assets and continue to be one of the strongest tools a trader can wield.
Using Cheddar Flow can help you find ideas on stocks you are watching and are not watching. Charting out S/R levels can only take a few minutes once mastered and you can from there decide if you want to follow the option flow.