Last week, there was a short squeeze in the stock market that lasted for two days. The squeeze occurred off a significant trend line, which was also a previous resistance level that the market had to break out of before experiencing the short squeeze in late January and early February. This trend line is critical because it has been tested three times, including in early January, before leading to a major short squeeze.
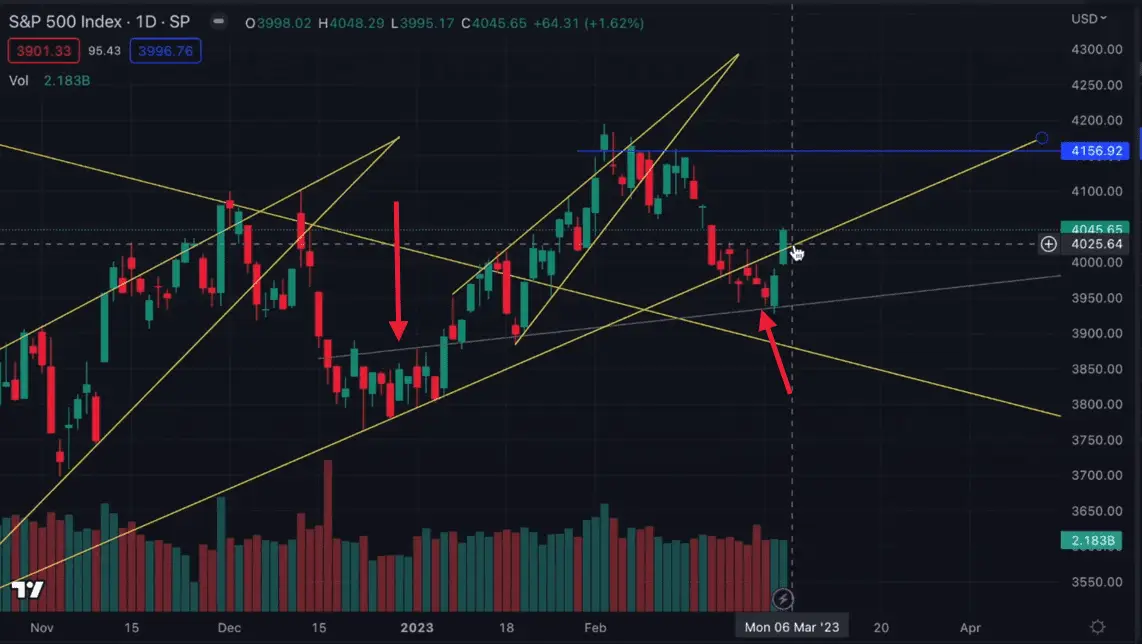
The current squeeze has brought the market back above a key trend line that originated from the October 13th low. However, it is not as bullish as it may seem because it is similar to a previous down trend that started in August. The up trend in that scenario was followed by a substantial gap down and continuation lower, which is something to be aware of.
The gap between 407 mid and 408 mid on SPY chart is also important to note. If this gap fills, especially with a break above the key trend line, it could be a bullish sign for short-term continuation upwards. However, for now, the market is experiencing a technical relief bounce, which is a common occurrence during bear markets when oversold conditions occur.
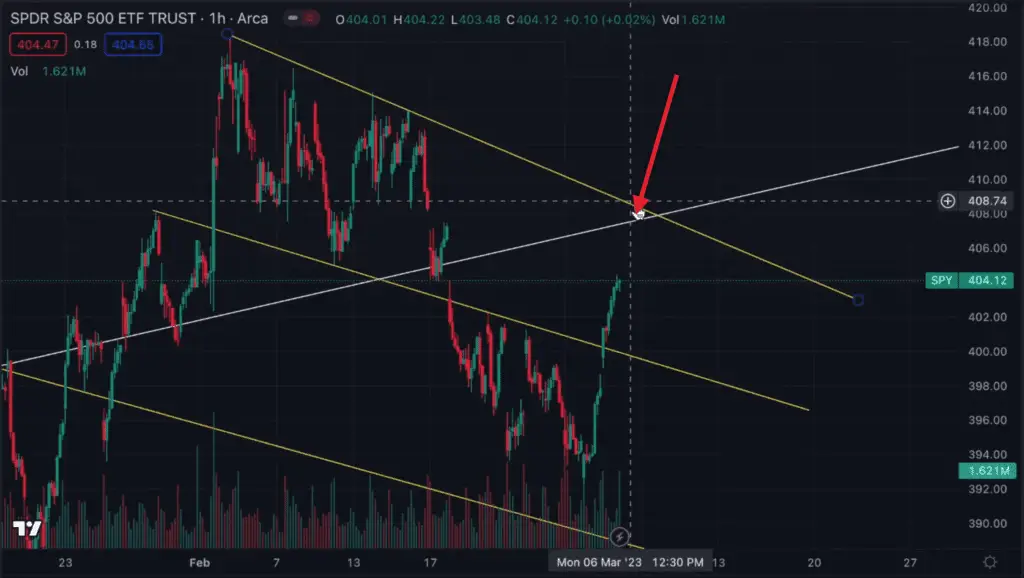
This relief bounce is a healthy way to relieve pressure to the downside, which has been building up due to the momentum of recent gap downs. The current bounce is decompressing this bearish momentum, and it is likely that the market will fall down again after some consolidation up here.
It is important to remain cautious when interpreting this price action because the recent substantial upside move tends to make many people bullish. It is worth noting that we have only seen two updates so far, and a lot of people turned bullish based on the upward price action during the two-day rally last week.
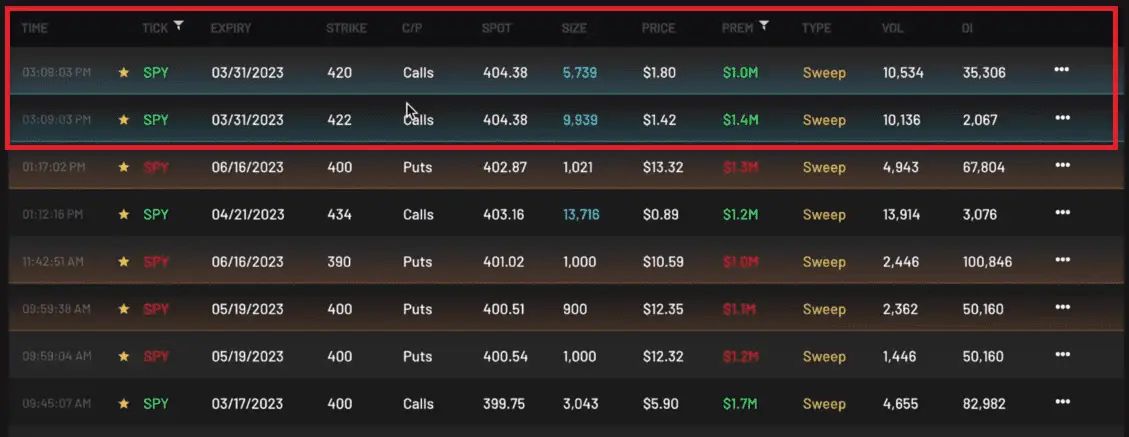
If you are looking for short-term hope, you can find it in the fact that around an hour before the close on Friday, March 3rd, there was 2.4 million in premium for the 422 and 420 to strikes for the 3/31/2023 expirations, which are set to expire within a month. These are highly unusual prints that were likely bought, and they represent a potential over-the-weekend head for upside or a directional bet that we will have to see based on price action throughout this week.
Overall, it is important to keep in mind that this relief bounce is just a short-term bounce for now, and it is likely that the market will fall down again after some consolidation. Therefore, caution is advised when interpreting recent price action, and it is important to remain aware of potential downside risks.
Make sure to catch our full weekly recap video below: