The S&P 500 has been on a downward trend since mid-February, and despite a bounce on Friday, it remains outside of the rising wedge pattern. The market could retest the 398-399 range early this week, prompting a rejection for further downside afterwards.
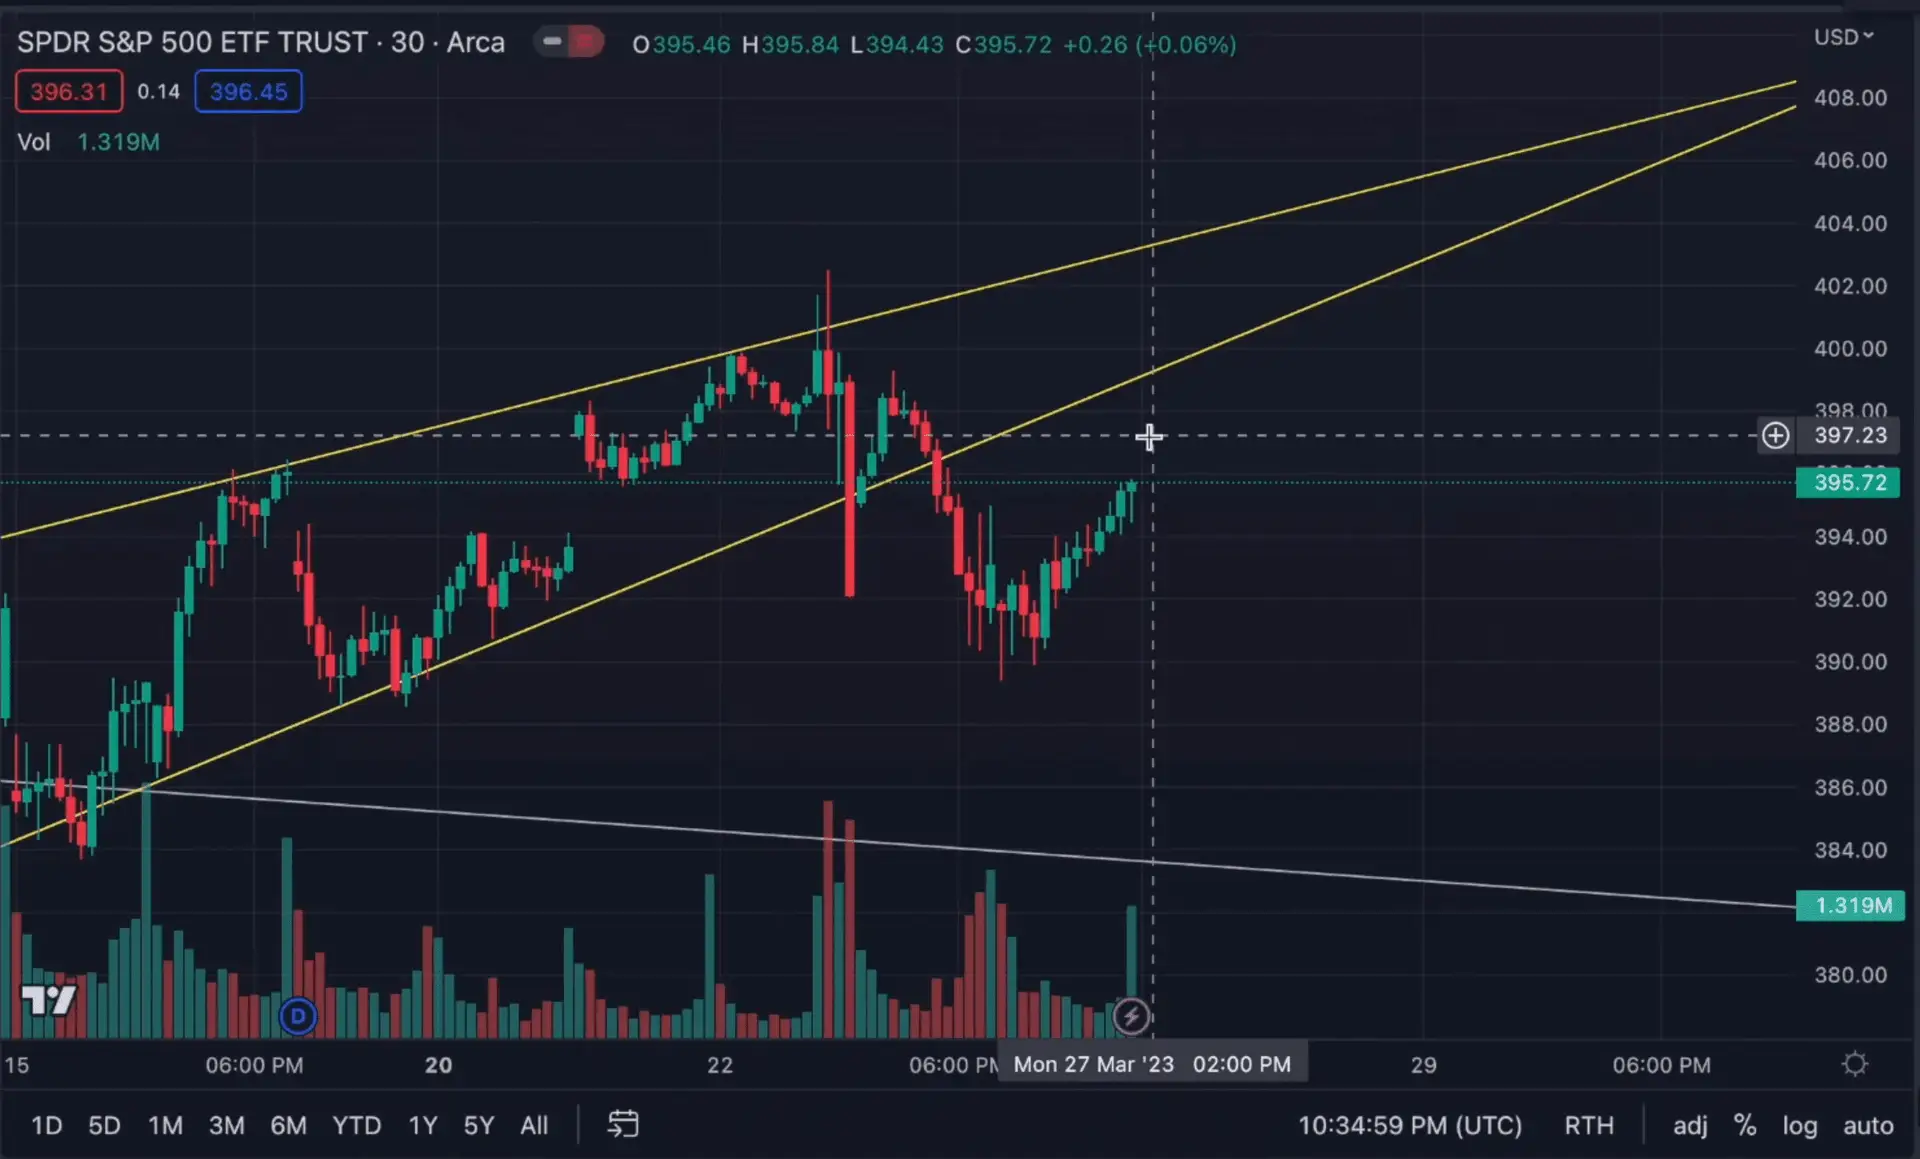
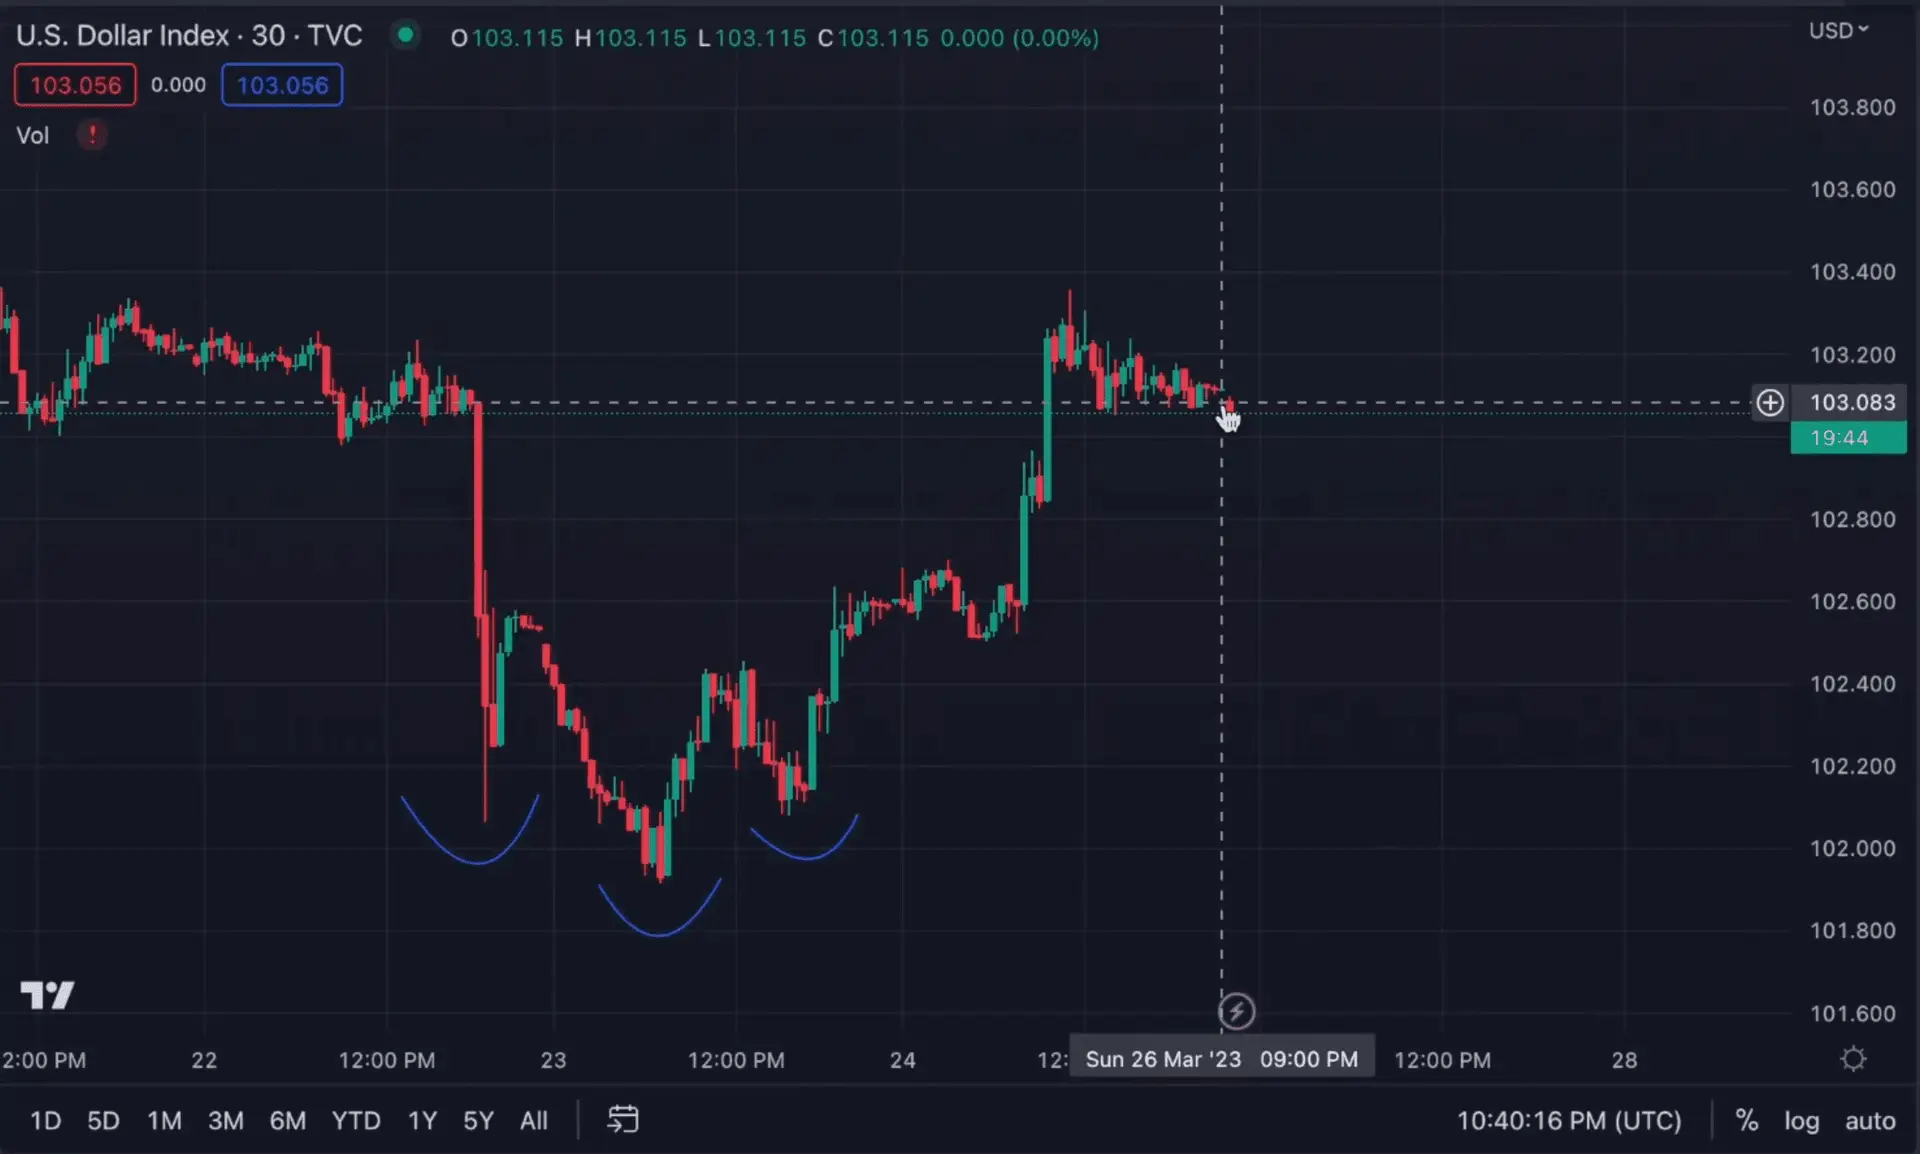
The short-term target is around the 382-383 level, which is a retest of the downward trend line on the S&P 500. The inverse head and shoulders pattern of DXY, the US dollar index, suggests more weakness in equities as it exhibits strength. This is because the strength of the dollar tends to weigh on the overall market.
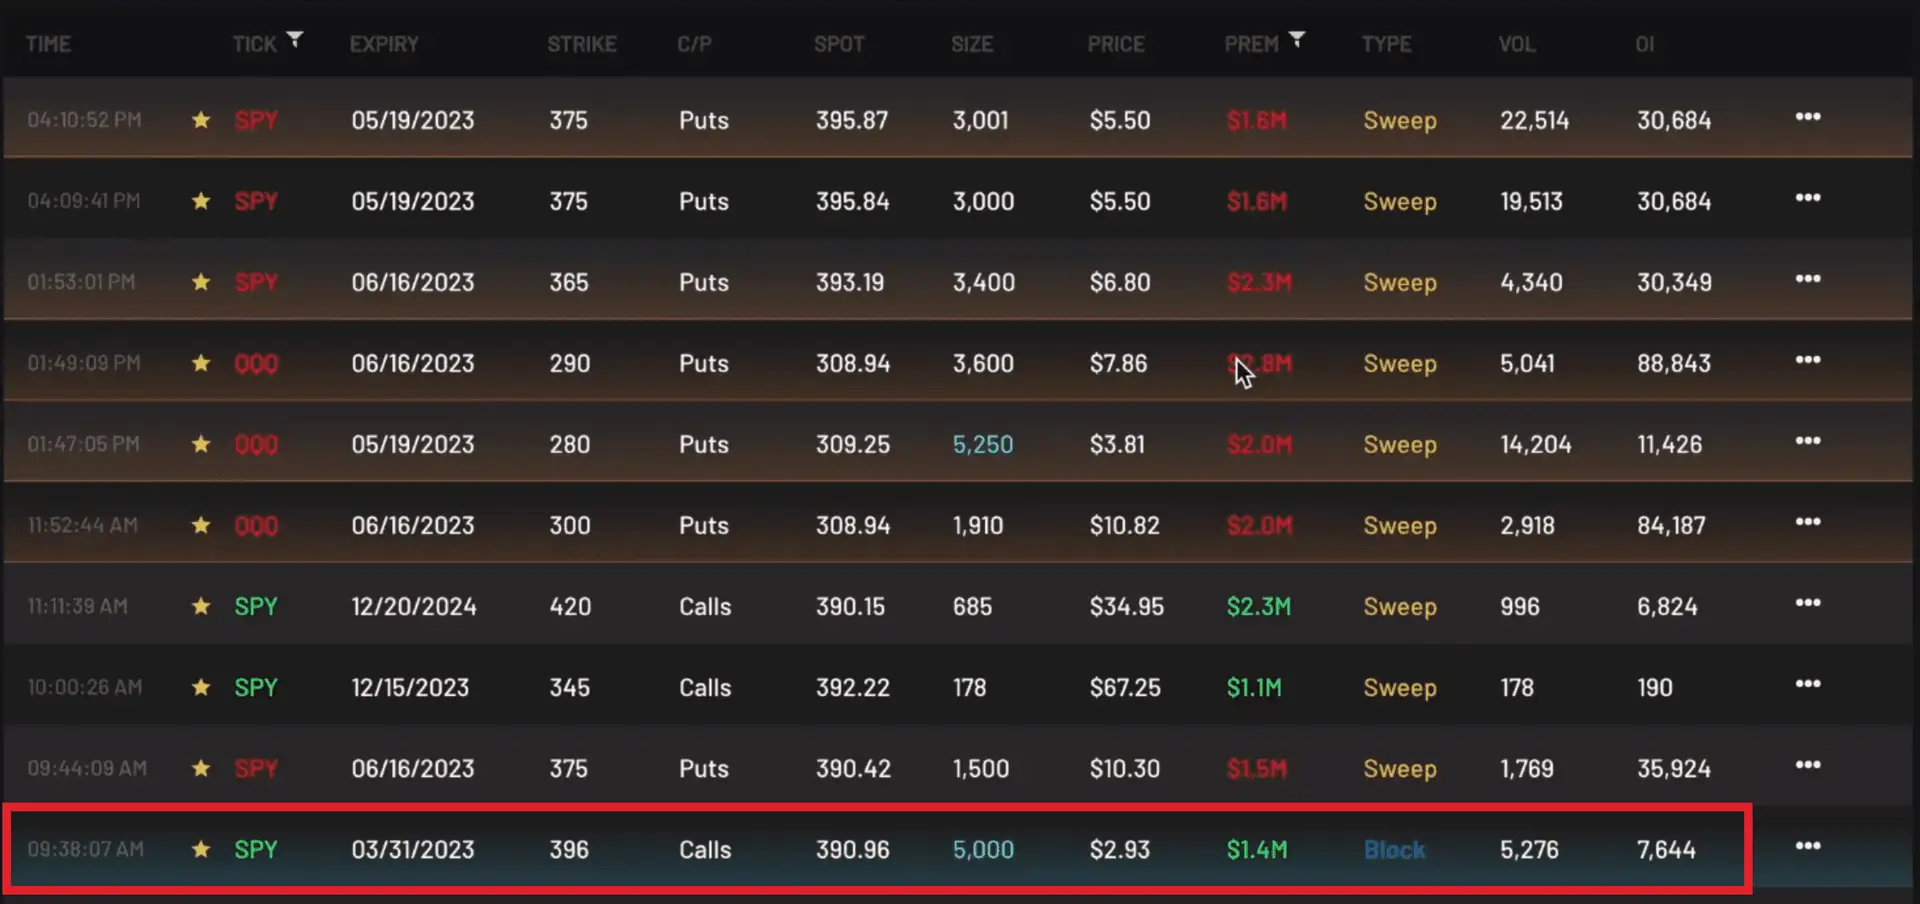
Looking at the whales’ behavior in terms of options order flow on Friday, there were a lot of puts near the end of the day, while the bullish flow has only been up until the end of March or very early April. A call of 1.4 million came in near the open of the trading session on Friday for the 396 strike, and the market closed right below 390.
The market remains within the downward trend, and breaking out of it requires breaking out of a few trend lines, one of which is the rising wedge. The bounce on Friday was more of a corrective bounce as long as it stays below the previous rising wedge. The market has yet to break out of the downward trend, and a red close on Monday would be a perfect indication of a rejection and further downside throughout the week.