According to recent market analysis, there has been a significant shift in the predicted target range for the Federal Reserve’s rate hikes, with a 54% chance that the new range will be between 5.25% and 5.5%. This is a substantial change from the original consensus of 4.5% to 4.75%. This shift in predicted rate hikes is likely to have an impact on the market, particularly as recent economic data has not been entirely favorable for the Federal Reserve’s current objectives.
There are concerns regarding inflation not decreasing as much as it should, as well as challenges in the job market. These macroeconomic factors are not currently working in favor of the Federal Reserve and may prompt further rate hikes in the future. If this is the case, it is likely that the market will experience similar pressures to what was seen throughout 2022, particularly if these conditions persist beyond March.
The previous consensus was that there would be a pause in rate hikes after March, with potential rate cuts later in the year. However, recent economic data has caused some shifts in this consensus. This change in market expectations is significant and should be carefully monitored.
Overall, there is a growing bearish emphasis in the market. While it is not necessary for there to be additional rate hikes beyond March for this thesis to play out, this shift in predicted rate hikes adds more fuel to the fire. It remains to be seen how the market will react in the coming weeks, particularly as these shifts are priced into the market.

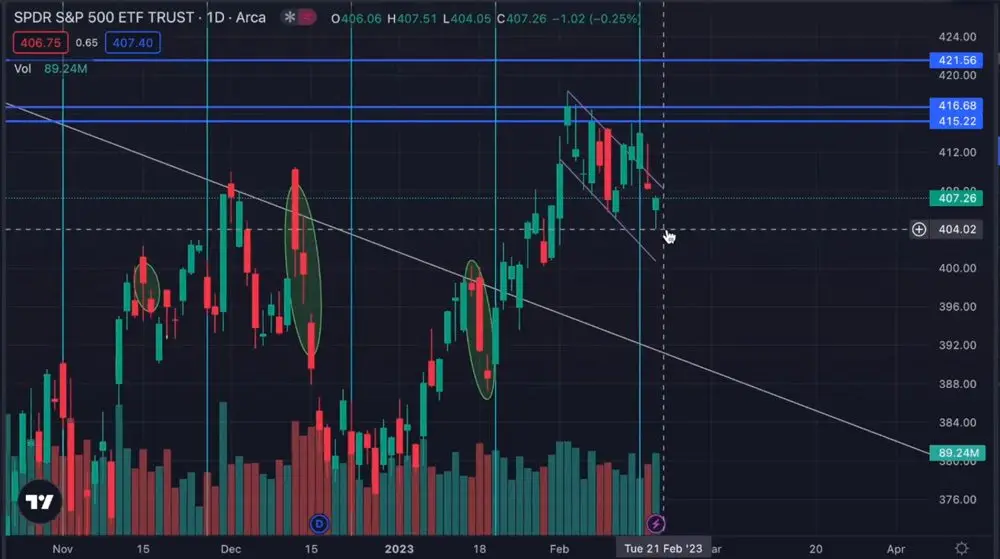
Reversal Day
Despite a bullish candle picking up last Friday, the market still ended the day in the red. As previously discussed in my last video, I use an 18 day reversal cycle to guide my analysis. While I have several other cycles that I use, this is one of the basic forms that I find helpful.
Although I do not typically share my reversal dates publicly, I have decided to share this one with my audience. It has played out well over the past year, as evidenced by the two-day reversal we have seen thus far. The minimum requirement for this cycle is at least three days, so there is potential for further downward continuation to meet this requirement.
As depicted in the chart, we saw upward momentum going into February 15th, which was the 18 day cycle. However, following that, we saw a very bearish candle that brought us back into a channel represented by two purple lines. Additionally, while Friday’s candle may have been green, the market closed negative. Overall, we have had two down days since the reversal day from the previous high, which has prompted a nice selloff.
Based on my analysis, I believe that this trend will continue throughout the coming week. It is essential that the lows from Friday are broken or at least those low levels. It will be important to monitor the market closely to see how it evolves in the days ahead.
Aggressive Put Order Flow
In addition, if we take a look at Cheddar Flow, we can observe an increase in put options traded last week. Specifically, on Friday alone, there were 1.7 million trades for the 386 strikes. These trades are becoming more aggressive and are focused on out-of-the-money bets.
While I have also noticed some activity on the 400-405 strike range, those trades are not as aggressive and still out-of-the-money from last week’s levels. However, the 386 and 395 strikes are significantly more aggressive and are out-of-the-money orders for July 21st expirations, which is a longer time frame than what we have seen in the past month.
It is important to note that the calls we have seen from the whales in the past month have been short-dated. The bullishness has not yet extended past the March expiration, indicating a possible shift in sentiment among market participants.

Vix Finally Moving
It’s important to note that charting the VIX can be difficult, so it should be taken with a grain of salt as it’s not the same as an individual ticker. However, there is a potential inverse head and shoulders pattern forming, with the left shoulder, head, and right shoulder clearly visible. What’s encouraging is that we’ve seen a positive reaction to the right shoulder forming.
There has been a bounce not only from the right shoulder but also from the retest of the demand range, as shown in the white box on the chart. Each time the demand range has been touched, it has prompted a bounce to 30 plus, typically around 33 to 37. This suggests a bullish reaction to this demand range. Overall, the weekly candle was a bullish pickup candle from the past week, and when it retested the demand range, it bounced off of that.

Make sure to catch our full weekly recap video below: