Drawing triangles on assets is one of the most common and simple patterns to exploit for traders. The ascending triangle pattern is typically a bullish formation that represents a great deal of information with a decent strike rate for a breakout. Our goal today is to show how you can begin to recognize this pattern with traditional technical analysis and combine it with order flow to establish a bullish thesis and profit.
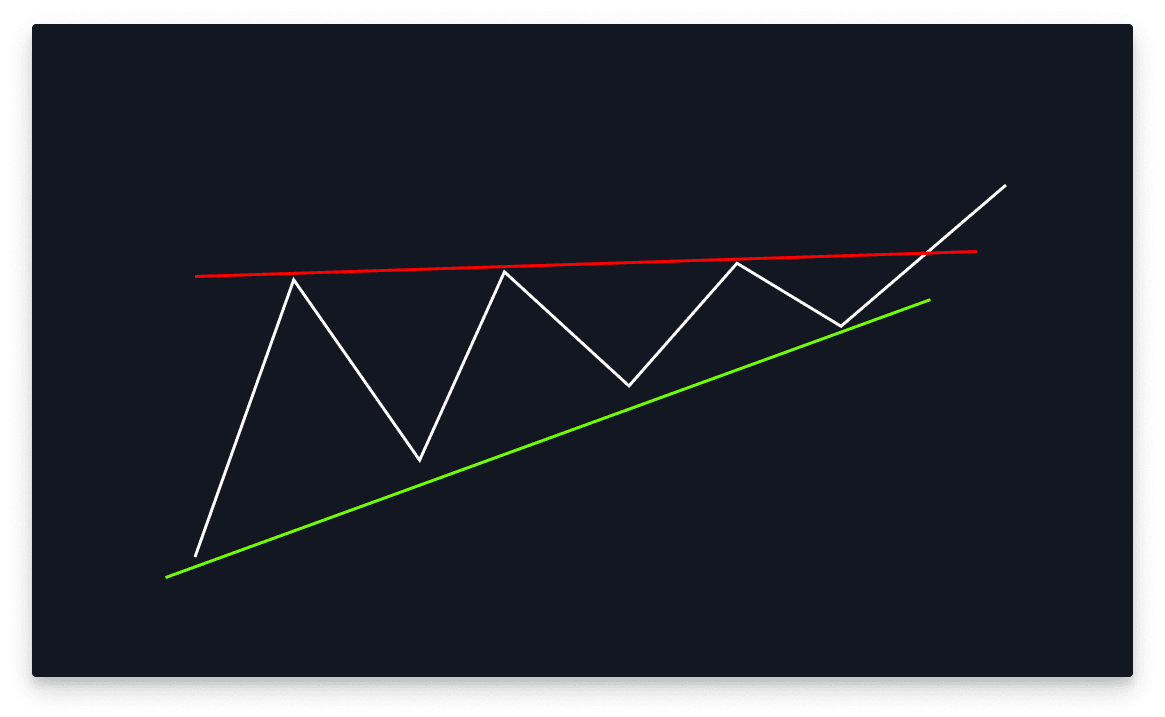
The basics of this pattern is formed by a horizontal trend line running alongside its peaks. As the price compresses within the triangle, it continues to put in higher lows implying an upwards impulse. Some traders will buy the trend line in anticipation of this pattern playing out, and others will wait for a break of the top line to confirm the validity of the pattern.
Like with any pattern, be careful of false breakouts. Prices may proceed to quickly move the other direction on you. Stay patient and monitor the momentum of price action.
Uber Technologies (UBER)
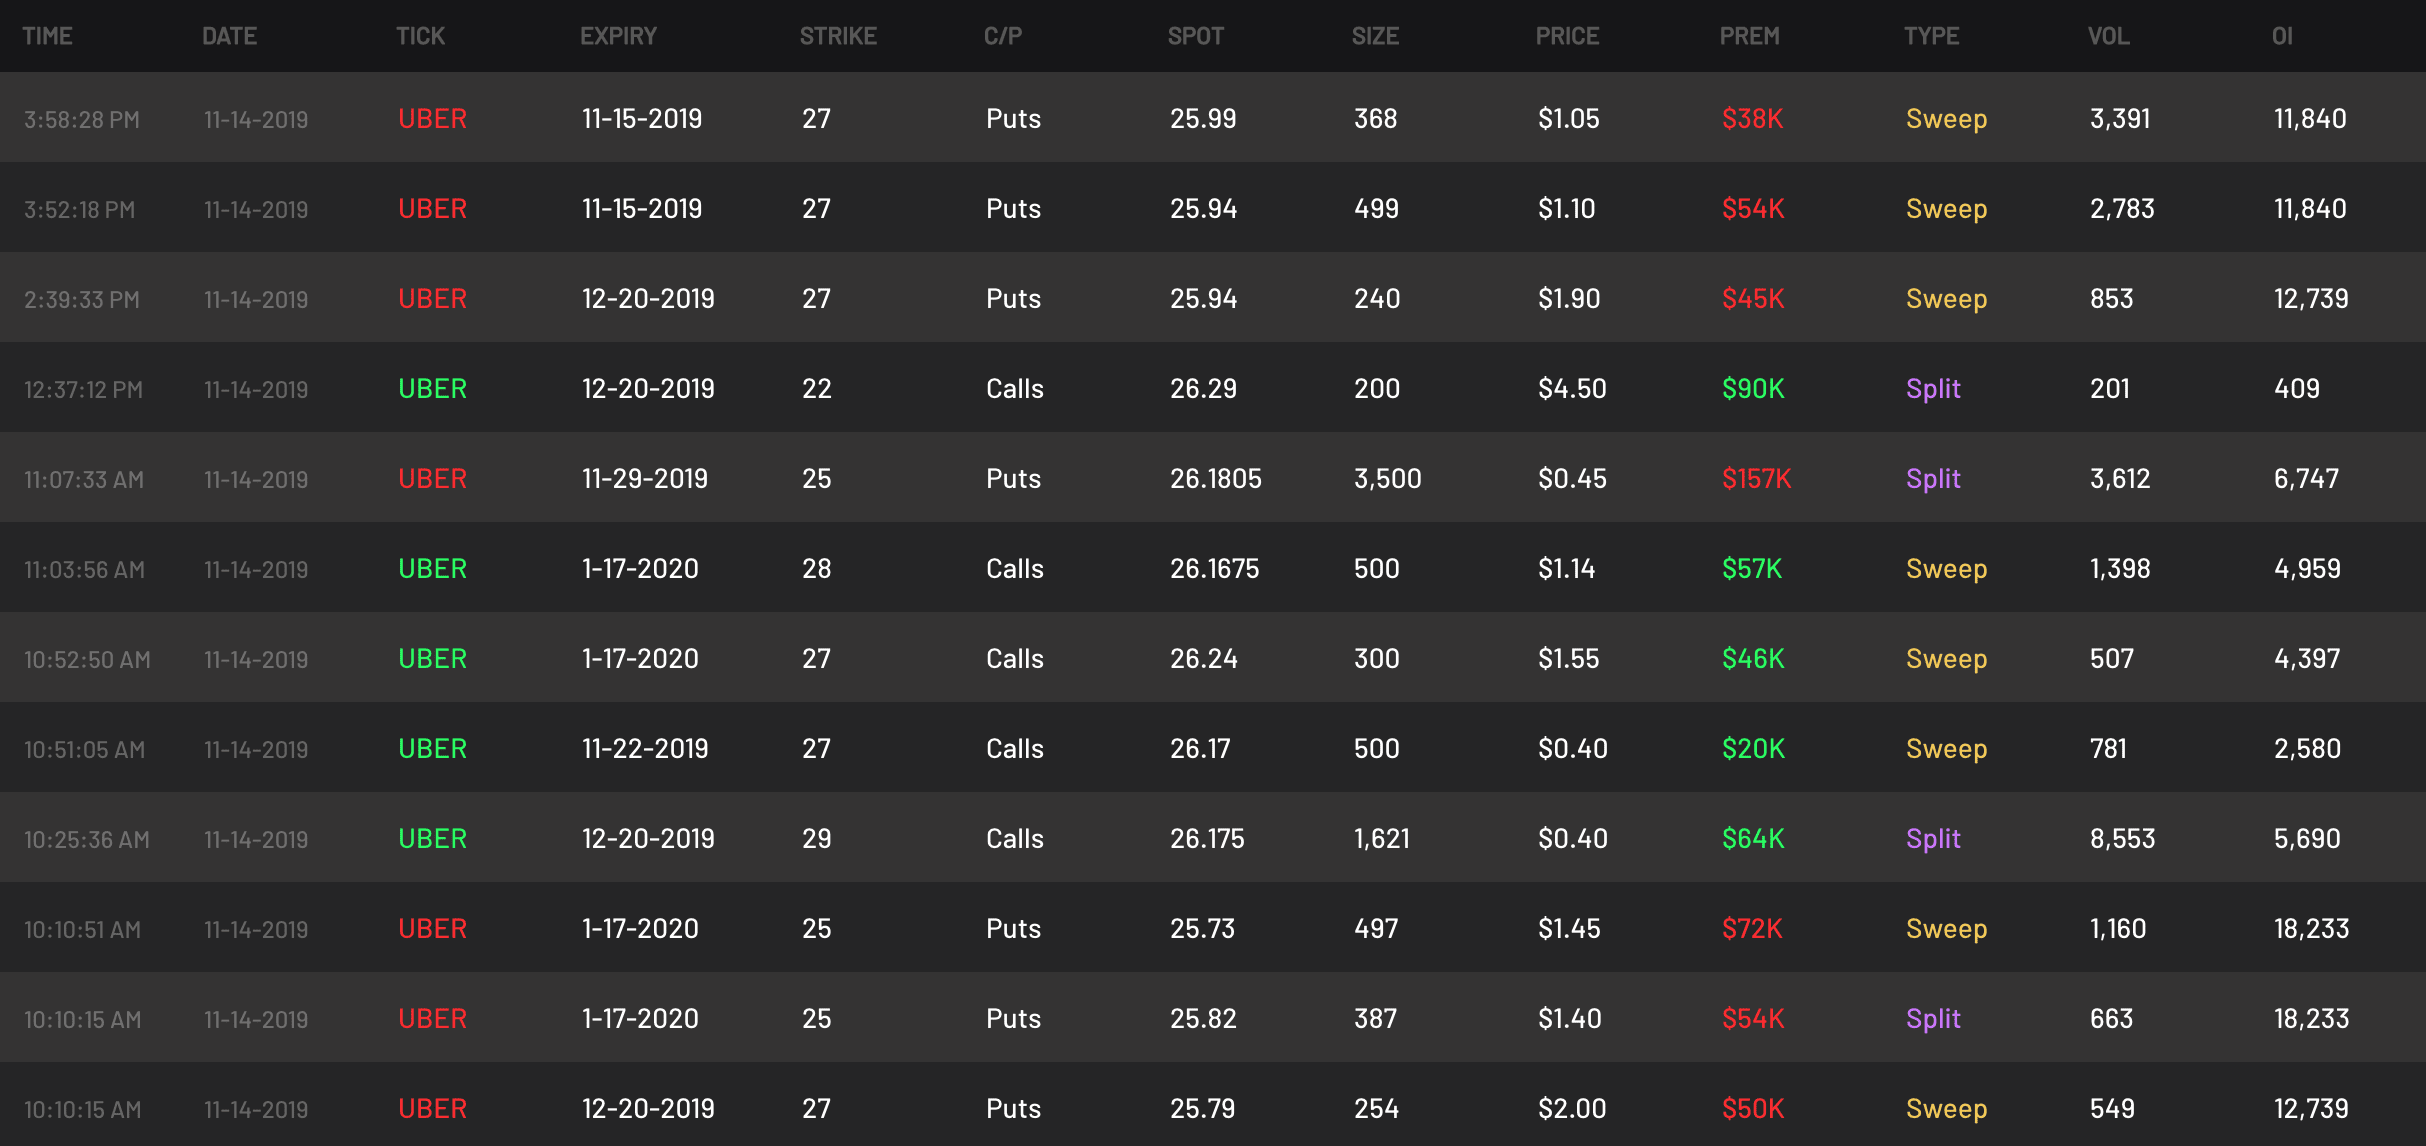
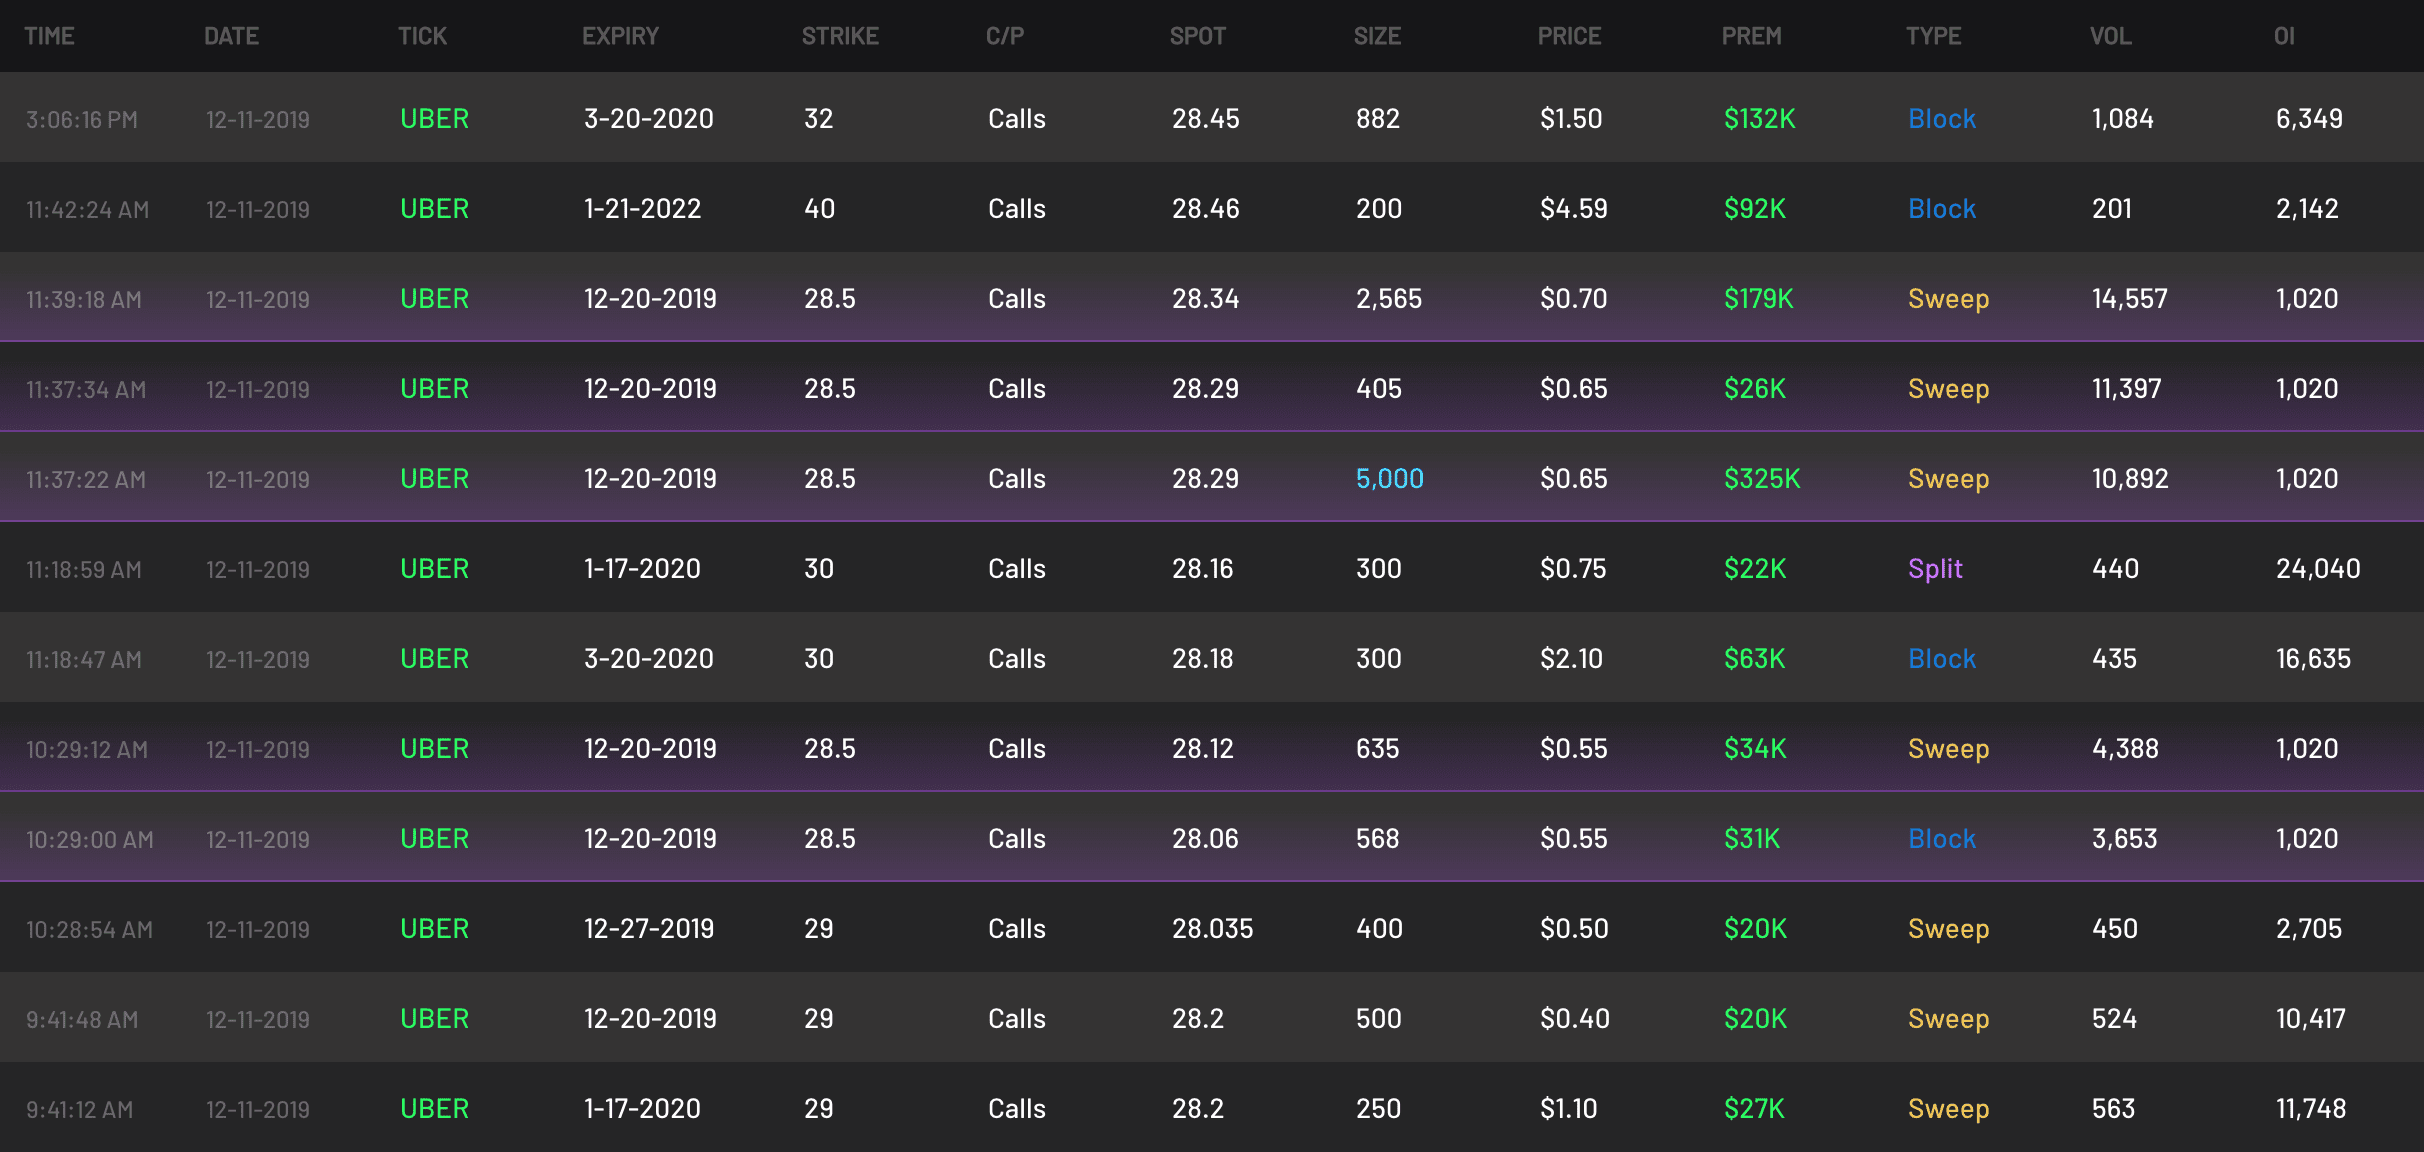
Uber is a stock that has done nothing but decline since It’s IPO. However, once it found a bottom, it printed the exact pattern bulls are looking for. When looking at the order flow, there’s a few dates we should really take a look at:
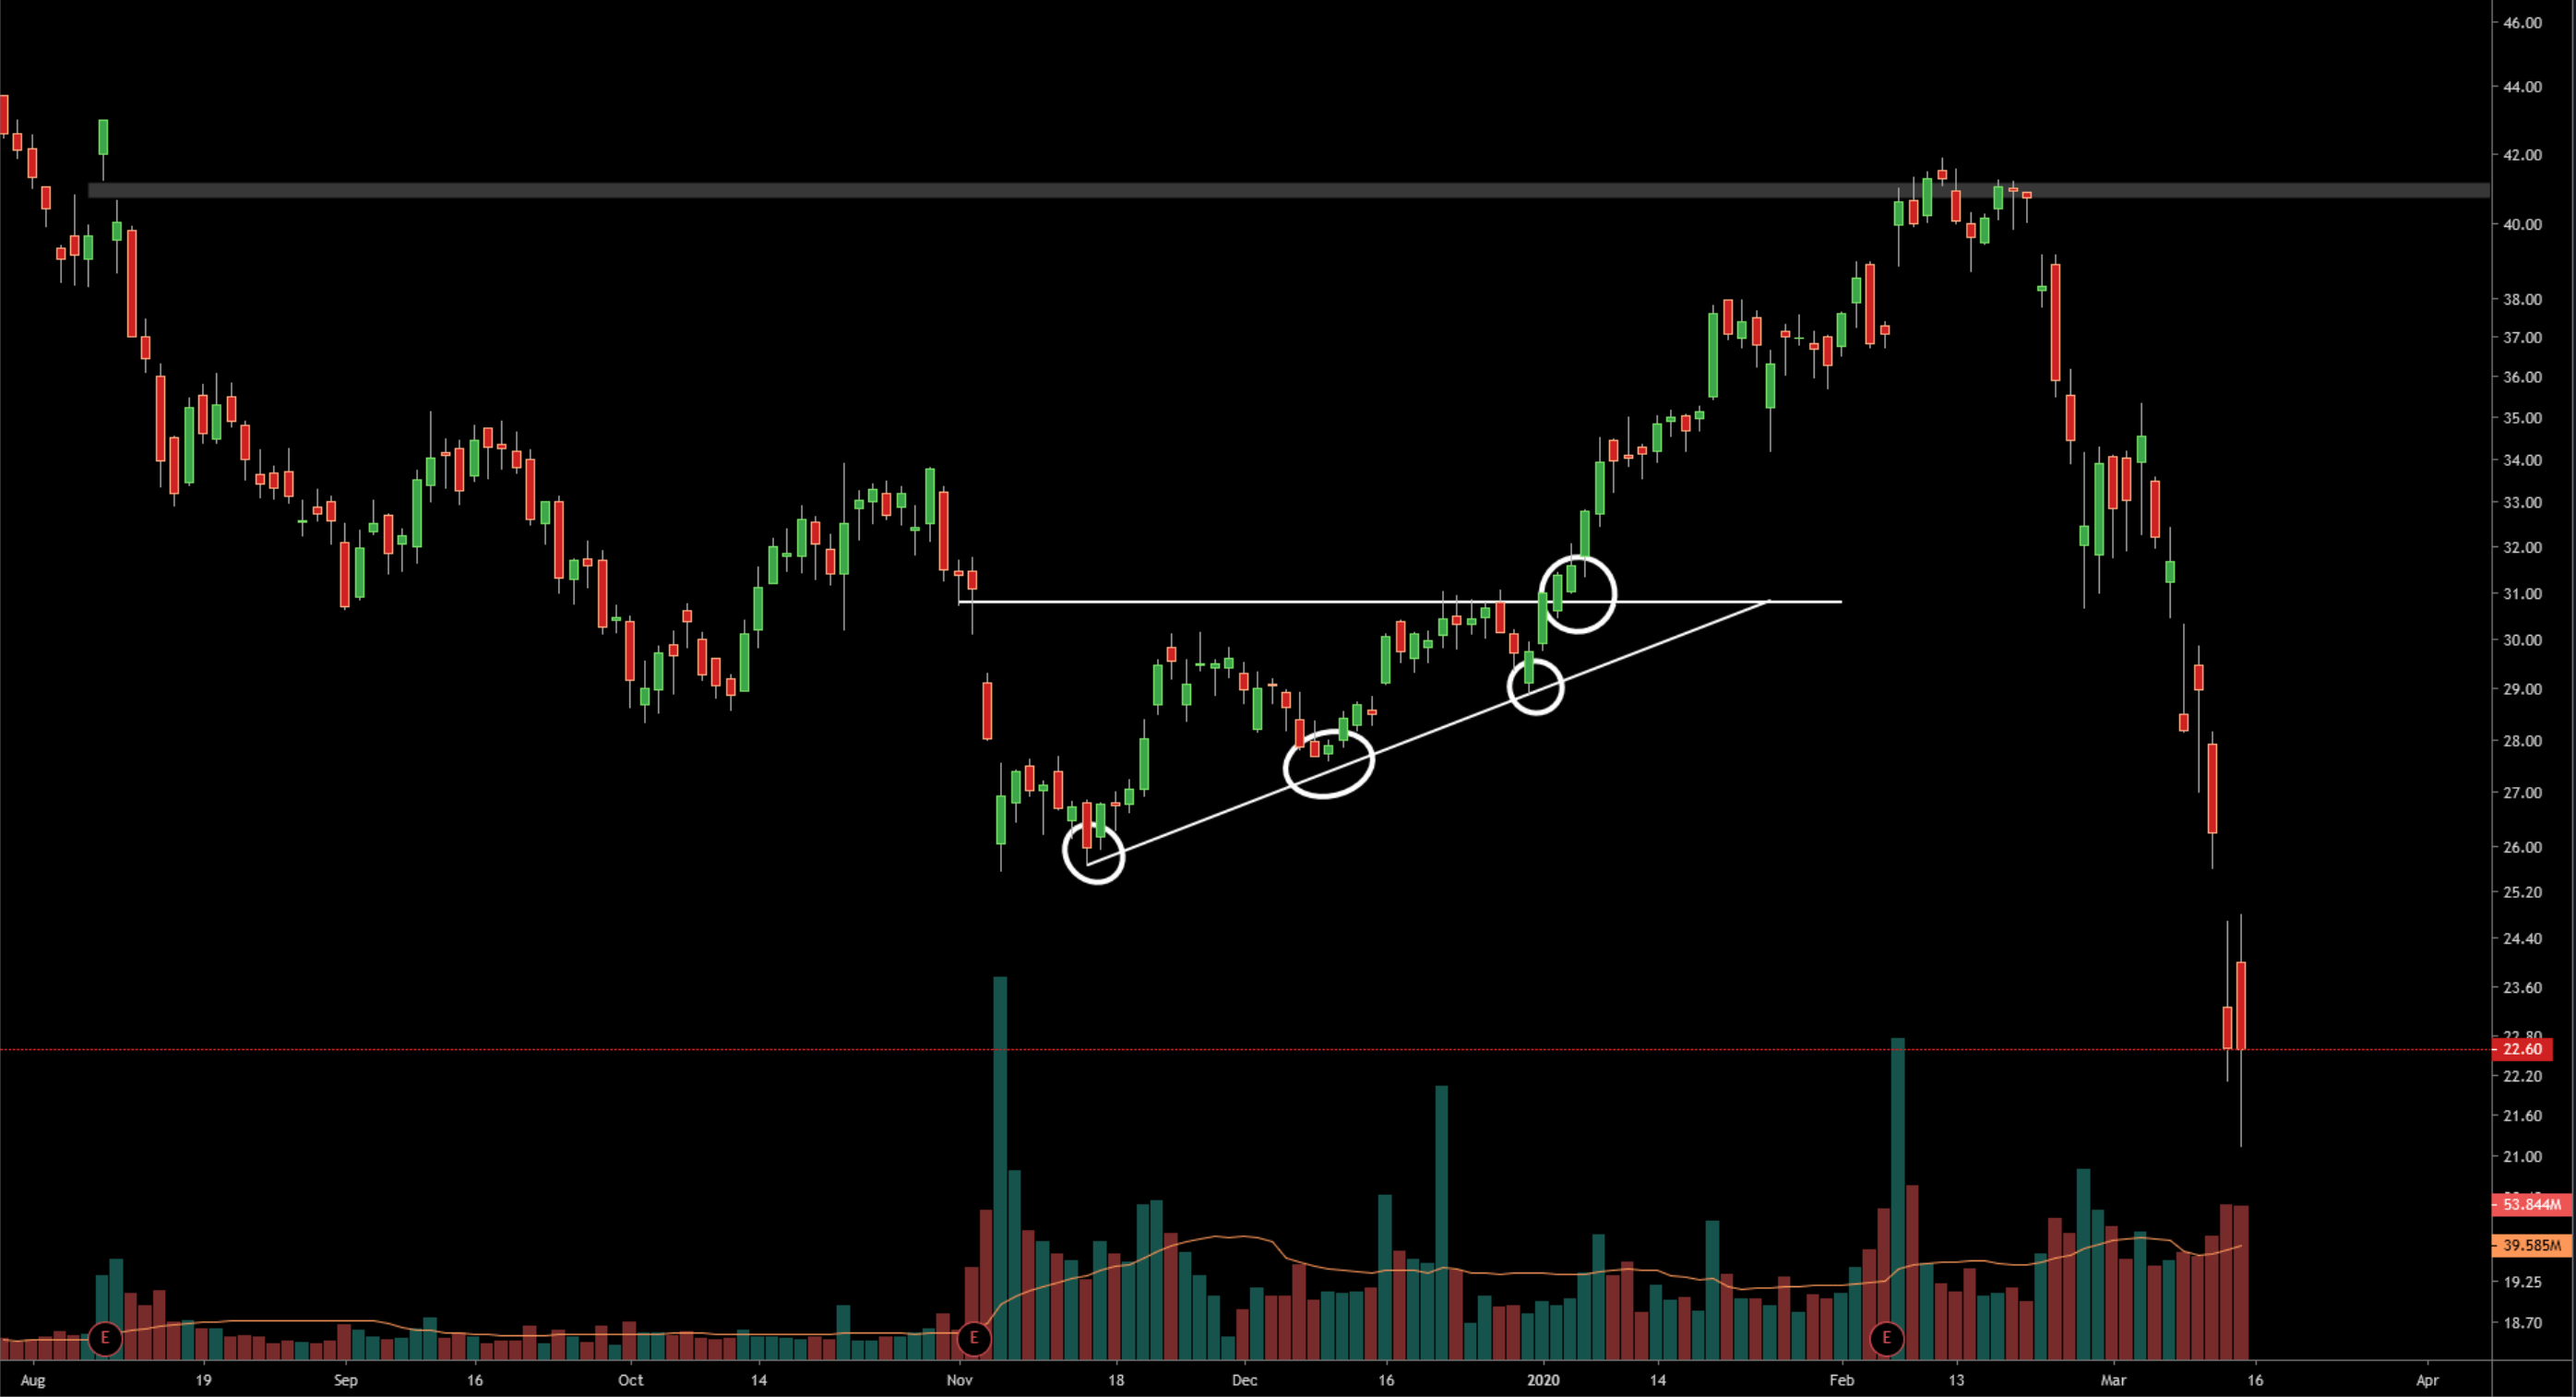
On November 11th, the first touch of the trend line saw some mixed flow. Bears are still expecting downwards movement. As to be expected.
On December 11th, the second touch of the trend line, bulls start seeing what is happening and we have a day of 100% bullish flow.
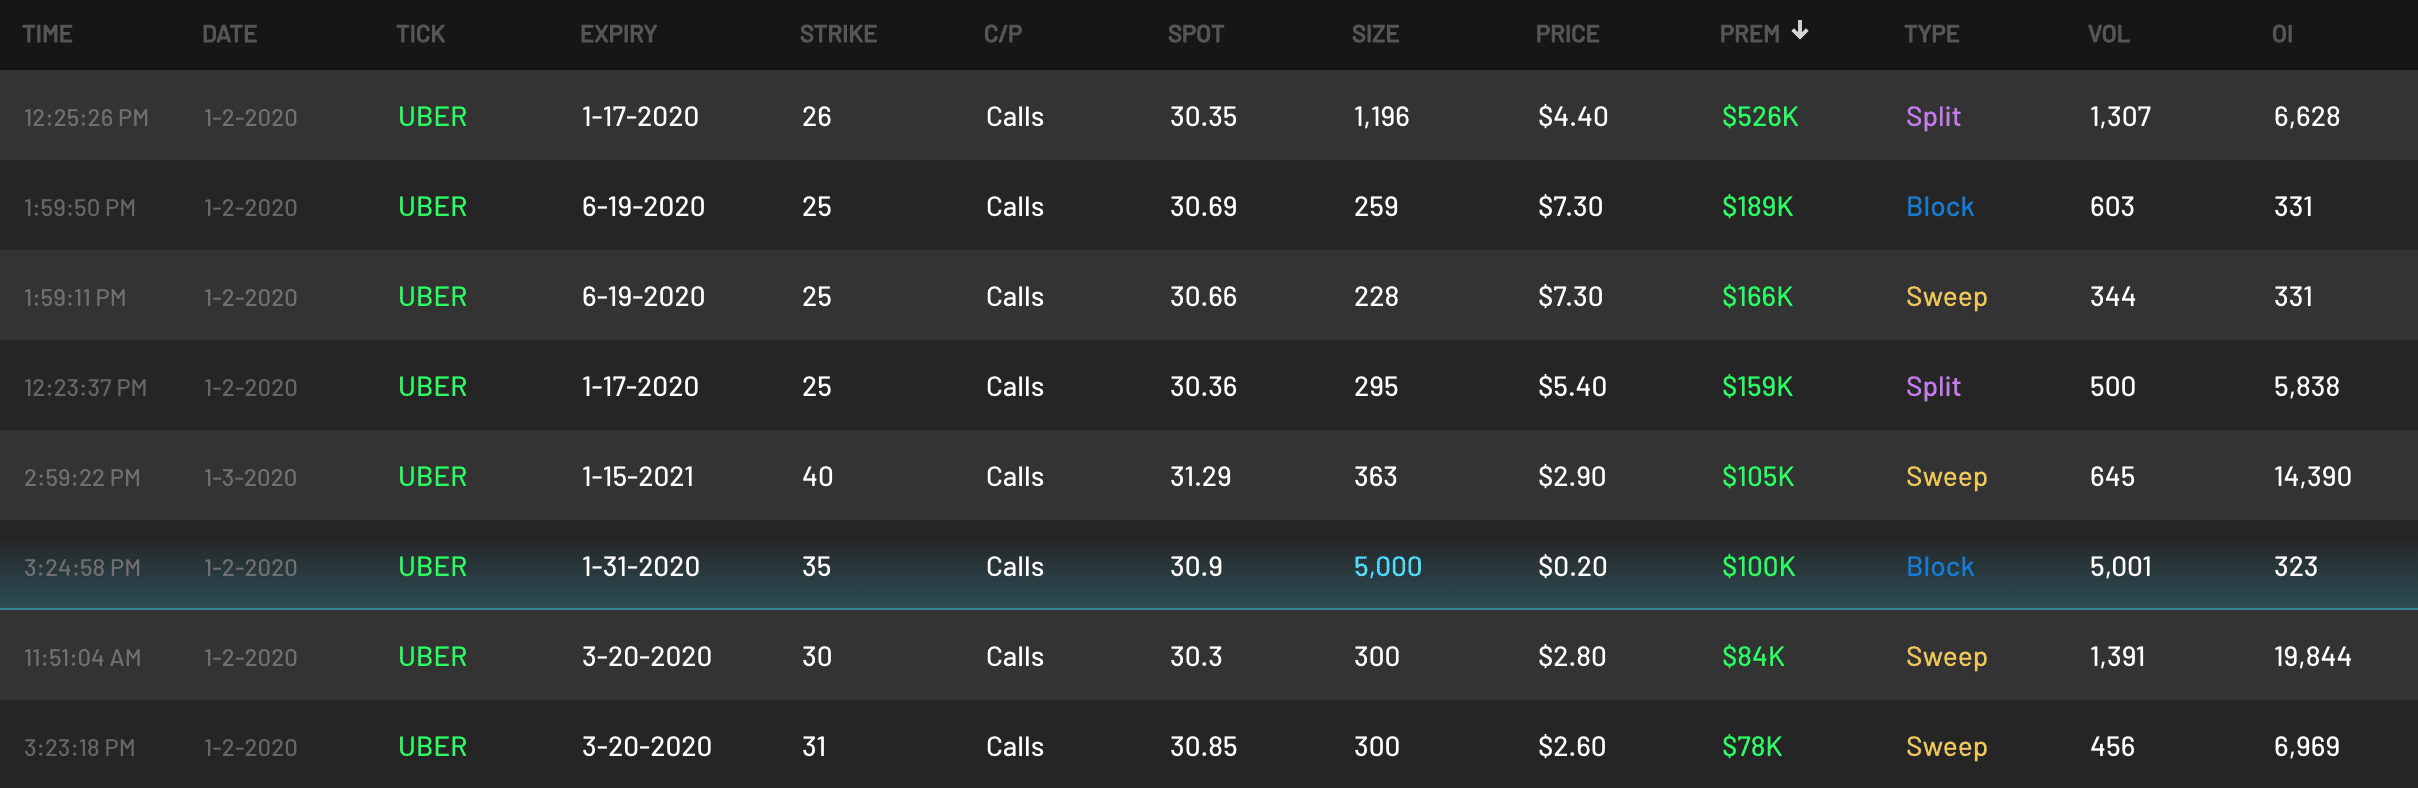
January 2nd was the third touch and we see almost 100% bullish order flow again. Good sign if you’ve been watching to go long. The breakout on the week of January 3rd produced much more bullish call buying with almost no puts. Together with your own analysis this could have produced a great entry.
Taiwan Semiconductor (TSM)
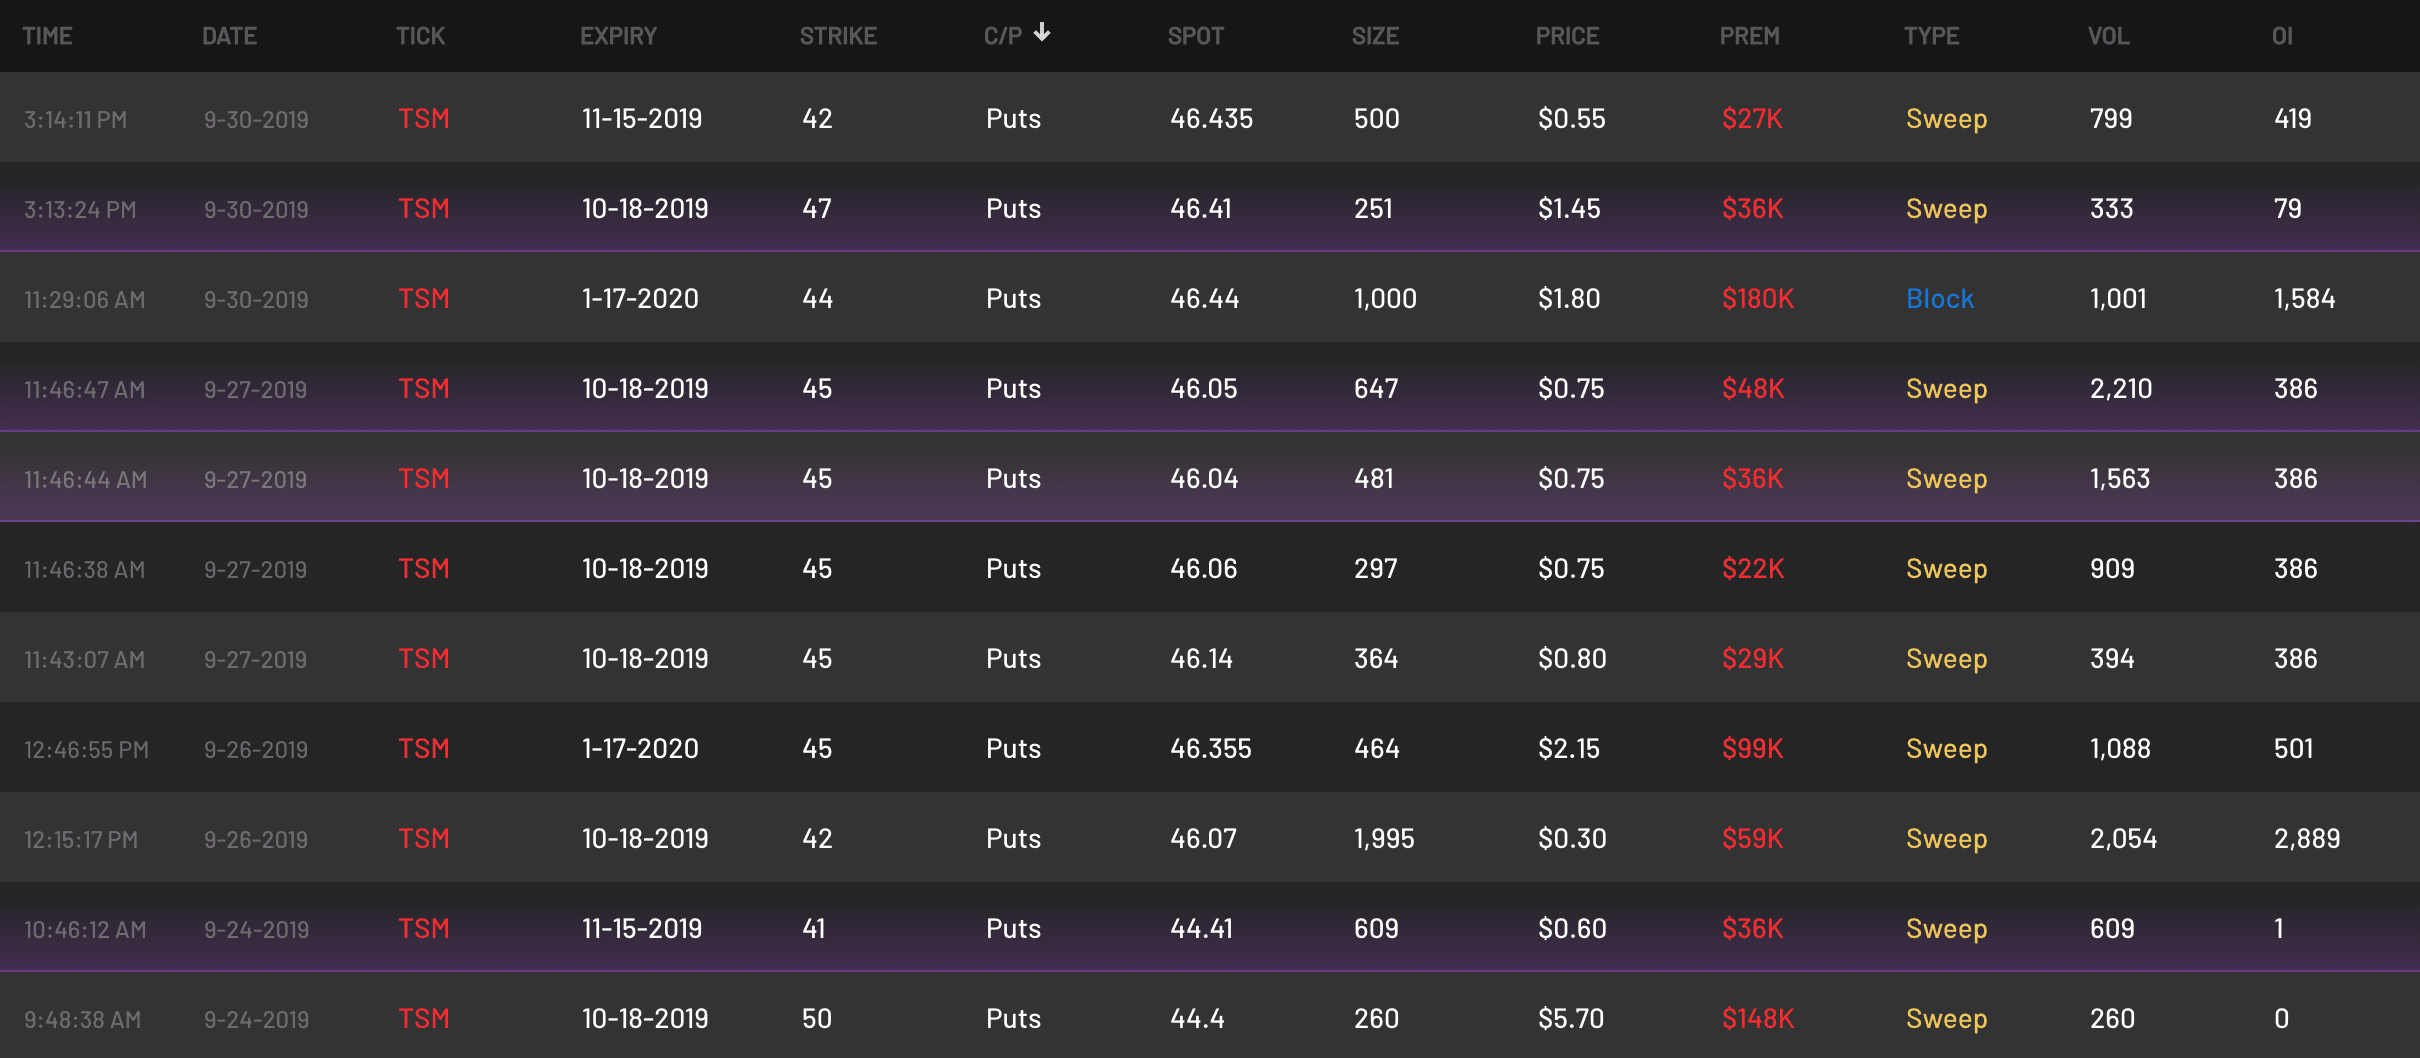
Bears were buying puts at a crucial resistance level because it had worked so many times before. Over and over they could short this for months for easy money.
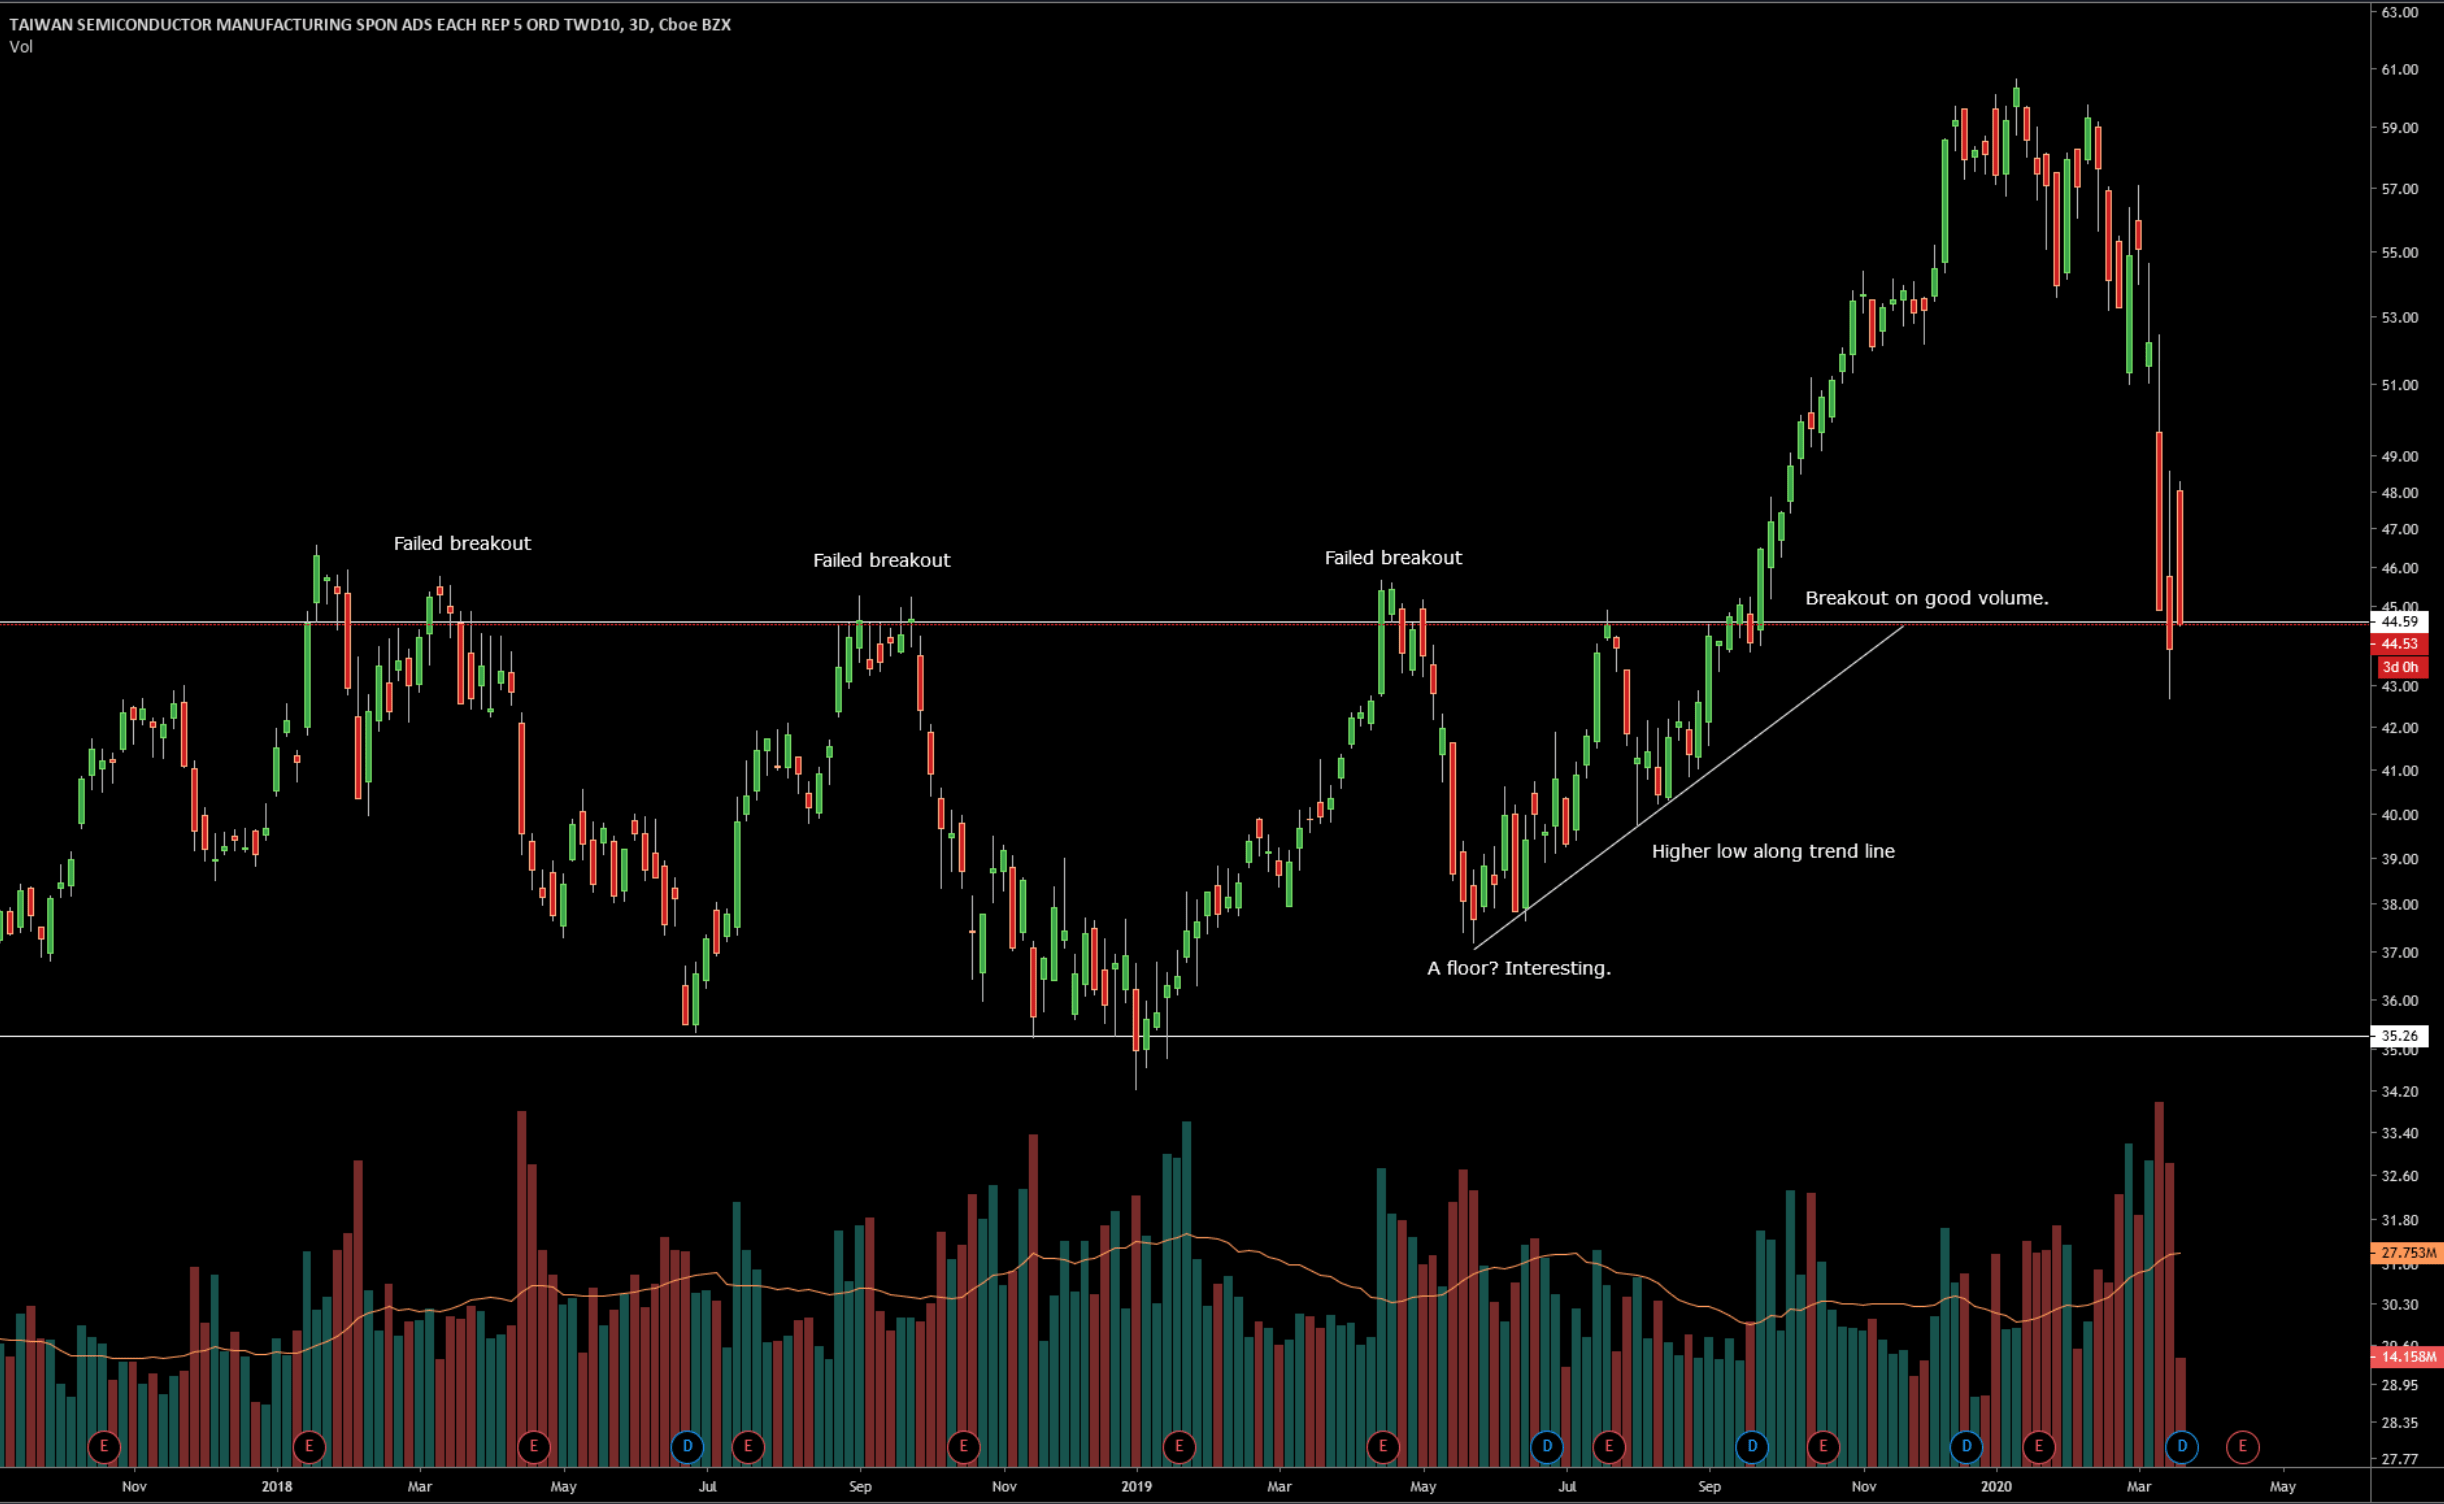
Until one day when TSM found a floor. It began printing an ascending triangle. Higher lows and compression followed by a breakout to the upside. Once TSM closed above the resistance level with high volume, it was off to the races. Anyone who followed this call flow once resistance was breached did well as the index soared 32% from the breakout.

Closing thoughts
Ascending triangles appear on all time frames large and small, but they tend to have more weight on higher time frames. With observation of order flow and proper risk management they can consistently result in profits for traders.
You can apply these patterns and order flow using Cheddar Flow