When it comes to commodity markets, the spot price often grabs the spotlight, but the full story unfolds across the entire futures curve.
Sure, the front-month price grabs most of the headlines; it’s flashy, immediate, and feels like the pulse of the market. But if you stop there, you’re missing the bigger picture. The futures curve, that arc of prices stretching across different maturities, holds the real clues.
And when it bends into backwardation, it’s telling you something critical about supply, demand, and market sentiment.
Backwardation acts as a roadmap for understanding market dynamics, and knowing how to read it can make all the difference. It reveals that today’s demand might be outpacing supply, or that storage levels are tight. For hedgers, it can mean benefiting from positive convenience yield. For speculators, it can scream opportunity, or risk, depending on how you read it. And for ETF managers? The curve’s shape can directly impact fund returns, sometimes in ways that catch even seasoned pros off guard.
But here’s the thing: the curve doesn’t stay static.
It shifts, often with little warning, and those shifts can mean big swings in portfolio performance. Misjudge it, and the losses can pile up fast. That’s why keeping an eye on inventory levels, macroeconomic trends, and even subtle changes in the curve’s slope is non-negotiable.
Backwardation isn’t just a feature of the market, it’s a roadmap, and knowing how to read it can make all the difference.
(adsbygoogle = window.adsbygoogle || []).push({});Understanding Backwardation and Contango
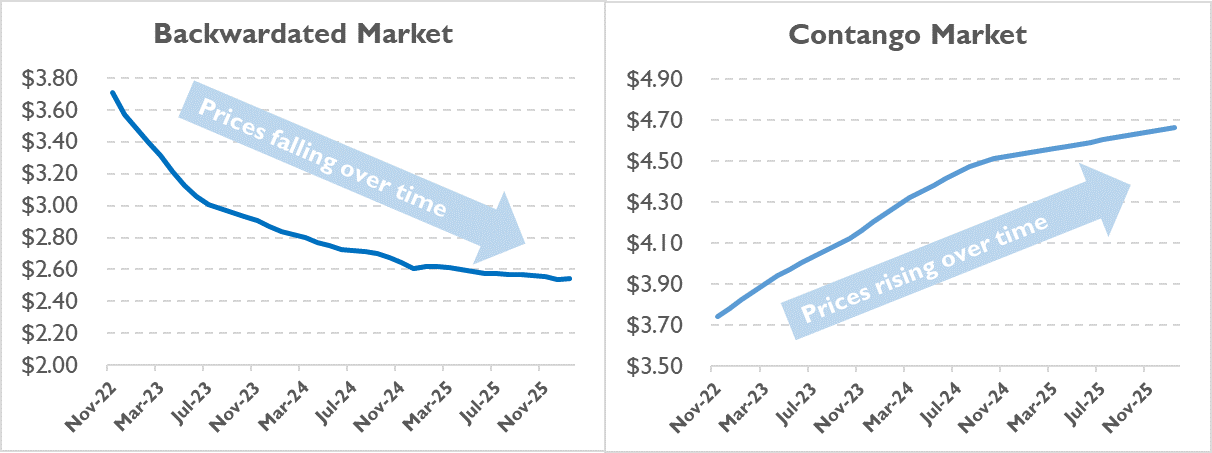
Backwardation and contango are two fundamental concepts that shape how commodity futures markets operate. At their core, they describe the relationship between spot prices and futures prices, revealing a range of underlying market dynamics.
Backwardation happens when the spot price of a commodity is higher than its futures price. This often signals tight supply or heightened demand for immediate delivery. Think of it as the market putting a premium on the “right now.”
Traders might see this when inventory levels are low or transportation bottlenecks disrupt supply chains. The futures curve in this case slopes downward, indicating that future contracts are cheaper the further out they go.
Contango flips the script entirely. Here, futures prices exceed the spot price, creating an upward-sloping curve. This typically reflects an oversupplied market or high storage costs.
Commodities with steep carrying costs, like crude oil, which requires storage tanks and insurance, often trade in contango when future supply outweighs immediate demand.
A couple of related terms come into play. Cost of carry explains the role storage and financing fees play in shaping futures prices. Meanwhile, convenience yield addresses the less tangible benefits of holding a physical commodity, like ensuring smooth production processes.
Convergence is another concept that matters here. As a futures contract nears expiration, its price aligns with the spot price. The convergence phenomenon is not limited to commodity markets. Virtually all futures markets will experience convergence in the front month contract towards the spot price as it nears expiry. This tends to smooth out disparities, leaving little room for arbitrage.
Ultimately, markets can shift between backwardation and contango as expectations, inventories, and macroeconomic factors evolve. For analysts, tracking these dynamics, visualizing them through futures curve charts, offers critical insights into market behavior over time.

Drivers and Signals of Backwardation
Understanding what drives backwardation starts with supply and demand, two forces that rarely sit still. Supply shortages are a big culprit, often triggered by geopolitical tensions, natural disasters, or production issues. When there’s not enough of a commodity to go around, spot prices jump above futures prices, signaling a classic backwardation scenario.
Add to that strong immediate demand, think power grids scrambling for natural gas during a cold snap, and you’ve got buyers willing to pay a premium for quick delivery.
Convenience yield is another major factor here. This reflects the tangible and intangible benefits of holding a physical commodity when future supplies are uncertain. For example, an oil company might value having barrels on hand during a potential supply crunch.
Meanwhile, high storage costs discourage holding inventories, prompting market participants to avoid accumulating excess stock, which keeps immediate supplies tight and supports higher spot prices.
Signals of backwardation often show up in the futures curve itself. A downward slope, where near-term contracts are priced higher than longer-term ones, is a dead giveaway.
Low inventory levels are another telltale sign, pointing to tight supply. And when spot prices consistently outpace futures, it’s clear that immediate demand is overpowering the market’s longer-term outlook.
But markets move, often dramatically. A supply shock, like a hurricane disrupting oil production, can flip a market into backwardation overnight. Inventory swings follow a similar pattern; when stockpiles drop sharply, backwardation tightens its grip.
For financial analysts, recognizing these shifts matters. Tools like real-time data tracking and futures curve analysis offer the edge needed to spot opportunities and avoid missteps.

Trading and Investing with Backwardation
To wrap things up, backwardation stands as a fascinating feature of the commodity markets, a window into market dynamics.
We’ve explored how backwardation impacts everything from roll yields to ETF performance, showing how the curve’s shape can either boost returns or quietly erode them. It’s all about understanding the mechanics, spot prices, futures pricing, and how high convenience yield relative to storage costs drives markets into backwardation.
And let’s not forget the bigger picture.
Backwardation evolves right alongside inventory levels, geopolitical events, and macroeconomic shifts. Staying on top of these changes, whether through futures curve analysis or real-time data, directly impacts your ability to make informed decisions.
For traders and analysts, this is actionable information that can shape strategies, highlight risks, and reveal opportunities.
At its core, backwardation is a signal, a roadmap for interpreting market sentiment and supply constraints.
For financial analysts, it’s a critical tool in the arsenal, offering insight into price trends and risk management strategies.
The curve tells you where the market has been and, more importantly, where it might be headed.