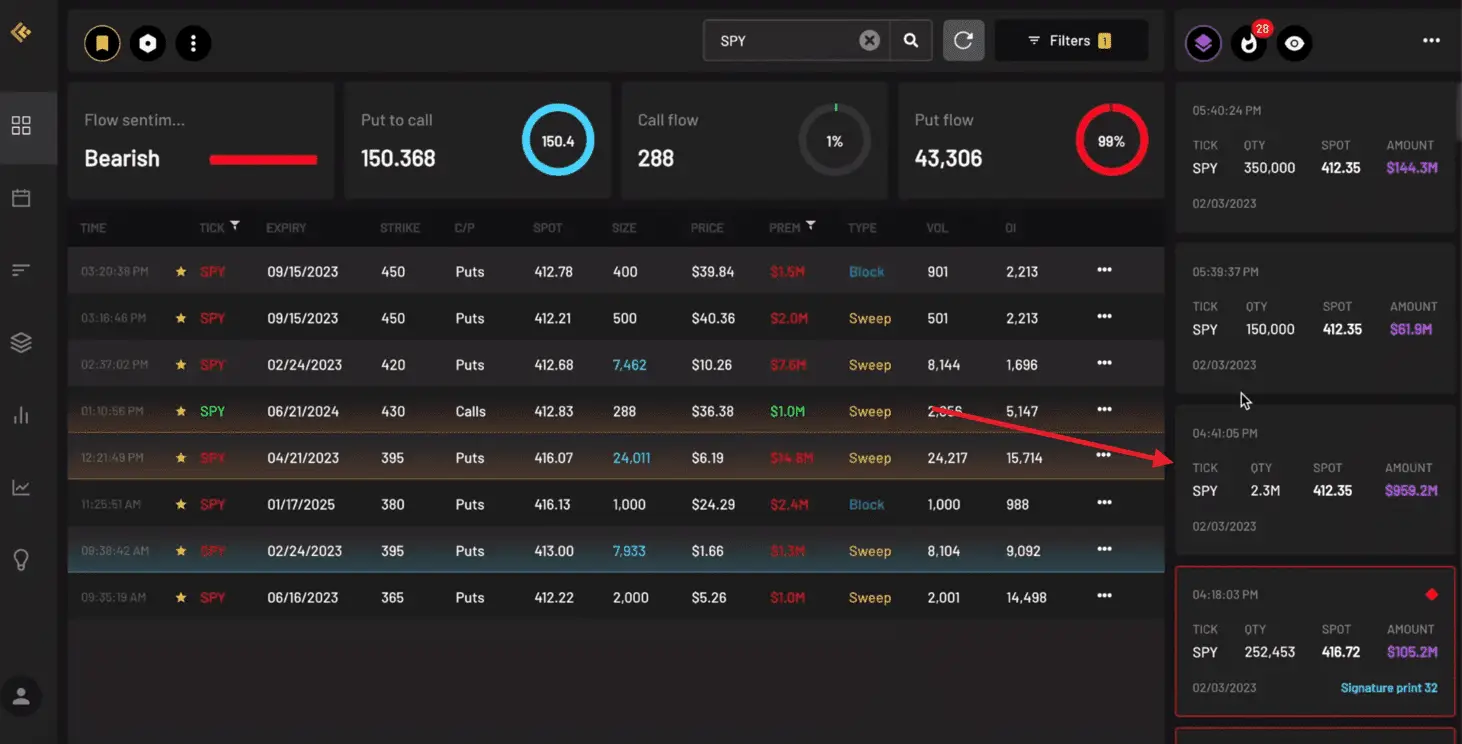
Whale bought $14.8 Million in puts
On Friday, Wall Street was abuzz with the news of an unusual out of the money put order worth $14.8 million. This rare occurrence saw the whale placing a premium on the 395 strike, which is significantly out of the money. With such a large sum being traded for a seemingly high-risk option, investors may be expecting some major market movements in the near future.
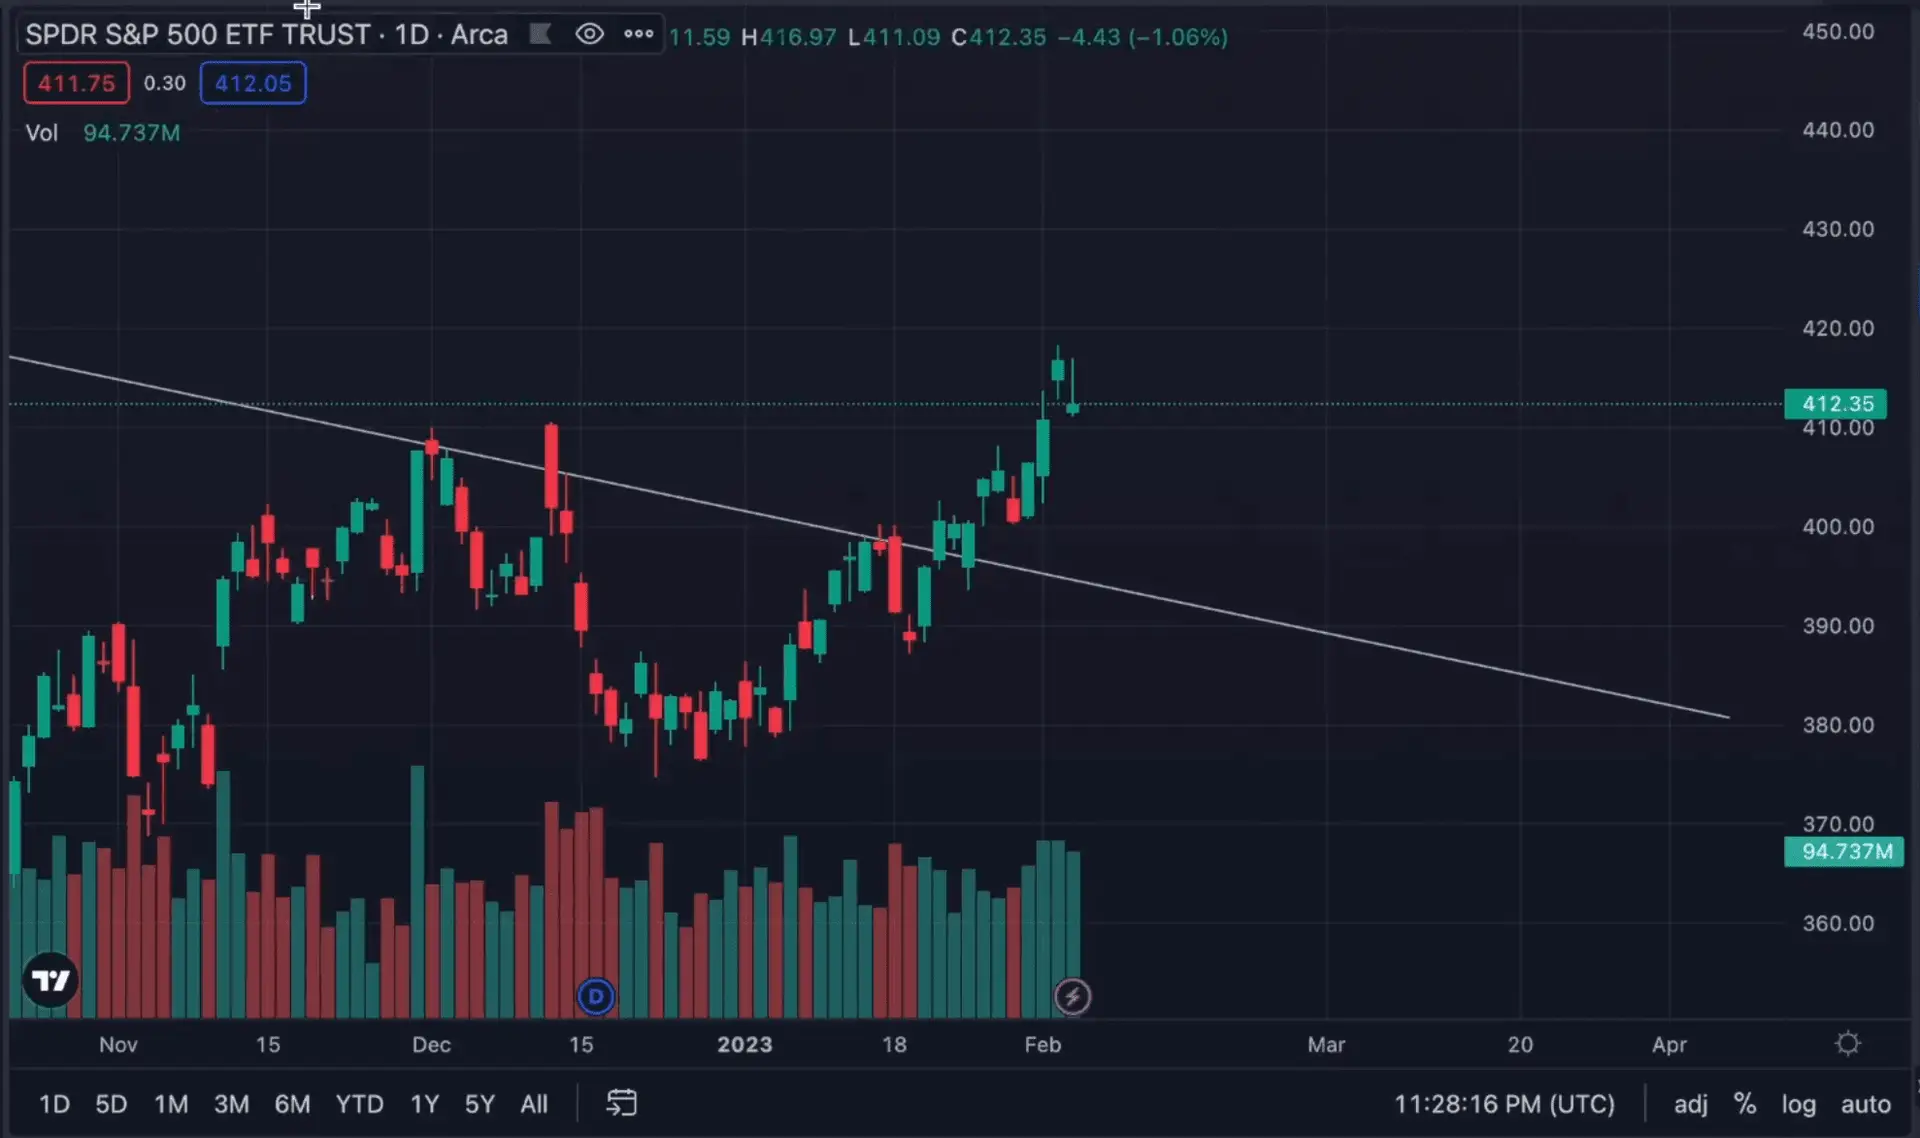
This trade is set to expire on 4/21 which isn’t too far away. At the time, the ask price was higher than usual, showing that the trader was eager to enter the position. It’s interesting if we look at the spot price of 416.07 when they initiated this trade.
When you go over to SPY, you can see that 416.07 happened to be the high of day range that we had on Friday.
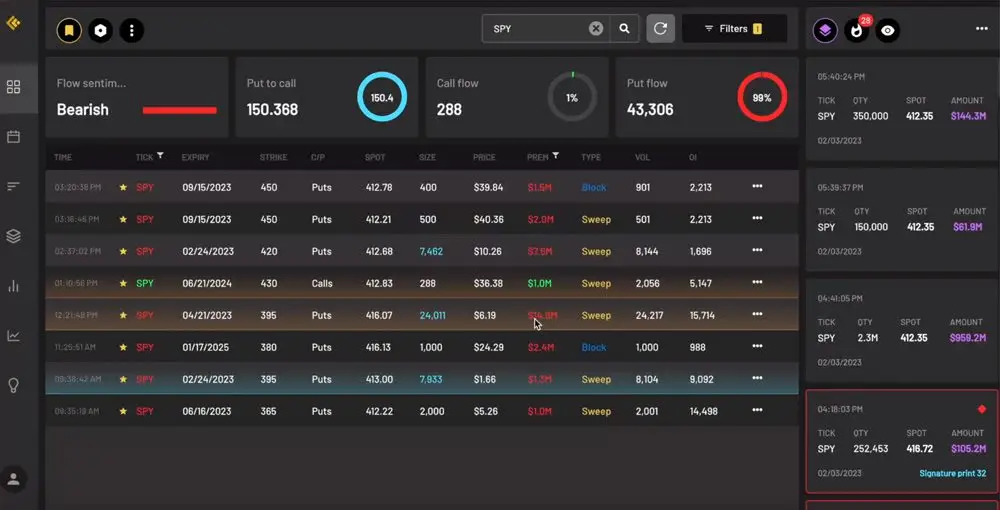
Dark pool trades getting active
SPY has witnessed substantial dark pool activity, particularly on Friday. Our analysis from Wednesday’s video indicated a minimal presence of dark pool activity. However, Friday’s observations revealed a considerable number of significant prints.
A singular dark pool print of nearly $1 billion was recorded after hours at a spot price of 412.35, which is a rare occurrence. Furthermore, we observed a substantial number of signature dark pool prints worth $3.2 billion in premium. This amount is substantial and rare to come by.
This level of activity in dark pool prints hasn’t been seen since December, with the last time we recorded such high numbers being a couple of months ago. The occurrence at 416.72 level, as indicated on the chart, is the highest point reached thus far.
Examining the SPY chart, we see that the 416 level acts as the peak, and if we were to retest it, it would act as a resistance. It is essential to mark this level of 416.72 on your charts. If we continue to witness premium orders of this magnitude, it could be an indication of the topping process for this move.

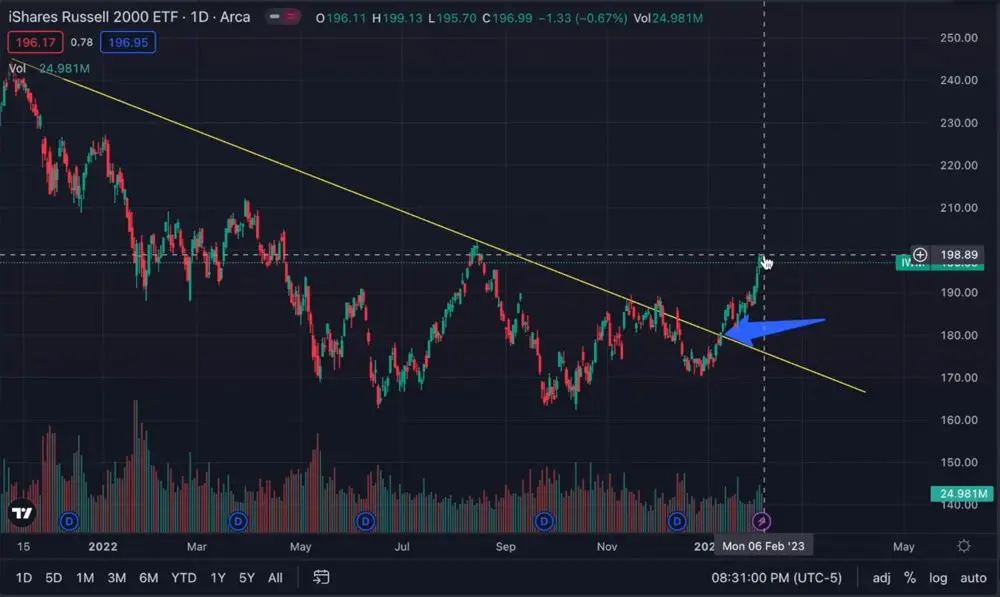
Downward trendline in IWM
IWM broke out of its downward trend line on January 11th, which has resulted in a significant upward continuation. It’s important to note that a break in a trend line does not necessarily mean a complete negation of the bear market structure and a return to all-time highs. There’s much more to consider.
For instance, during the dot-com crash of 2000, we saw a break of the downward trend line in major indexes such as NASDAQ and SPX, yet a 50% decline still occurred. While it is not expected to see a 50% decline from current levels, a fall back to retest the trend line and evaluation of future prospects is a possibility.
Make sure to catch our full weekly recap video below: