Apple Earnings Preview
On Thursday May 4th, 2023, Apple reports its Q2 earnings results. The quarter covers the months of January to March. The street is expecting EPS of $1.43 on $91-98 billion in revenue. This would imply a 5-6% contraction on both revenue and EPS on a YoY basis. In Apple’s conference call, market participants will be looking forward to hearing comments about macroeconomic headwinds and the Q3 outlook. Since 2020, Apple has not formally provided guidance so investors use the conference call for hints about the financial outlook.
Fundamental Analysis
Apple’s last quarter earnings release, which covered the 2022 holiday shopping season, reported its first quarterly earnings miss in 7 years. The shocking results came as the CEO Tim Cook cited three reasons for the earnings miss. China production issues affecting iPhone sales, a strong dollar, and the “overall macroeconomic environment.”
CFO Luca Maestri did provide some commentary about Apple’s Q2 outlook:
Q2 revenue would have a similar declining trend as the Q1 results.
Expect FX headwinds of 5%
Services should grow and iPhone sales should pick up.
Mac and iPad sales should decline double digits YoY due to “tough comps” and a “rough macro landscape.”
Tax rate of 16%, gross margins from 43.5% to 44.5%, and Opex rise of $200 million.
Needless to say, since the conference call on April 11th, market intelligence provider IDC said that Apple’s Mac shipments have fallen 40.5% in Q1 of 2023, the worst decline in 23 years. The drop in shipments is worse than Apple’s major competitors in the space.
Apple Insiders and Executives are Selling Stock
According to SecForm4, Apple executives have been selling shares in bulk since the start of April 2023. Most notable is the CEO Tim Cook’s first stock sale in 2 years. He sold 56k shares at the price of $165, bringing the total amount to $9.2 million.
Apple’s Supply Chain, Revenue Drop, and Weak Demand Issues
Recently, TSMC and Foxconn both reported a drop in revenue in their last quarterly earnings report. Foxconn saw a 21% drop in revenue while analysts believe that Apple accounts for nearly half of the total revenue for the company. TSMC saw a 15% drop in quarterly revenue. They supply Apple with its A/M series chips. Also noteworthy is the recent earnings from Samsung, one of Apple’s biggest competitors. Samsung reported its worst quarterly earnings in 14 years from weak product and chip demand. Samsung’s global market share for smartphones accounts for 19% while Apple’s is 23%. Investors should remember that the iPhone accounts for nearly 52% of Apple’s total revenue.
Technical Analysis
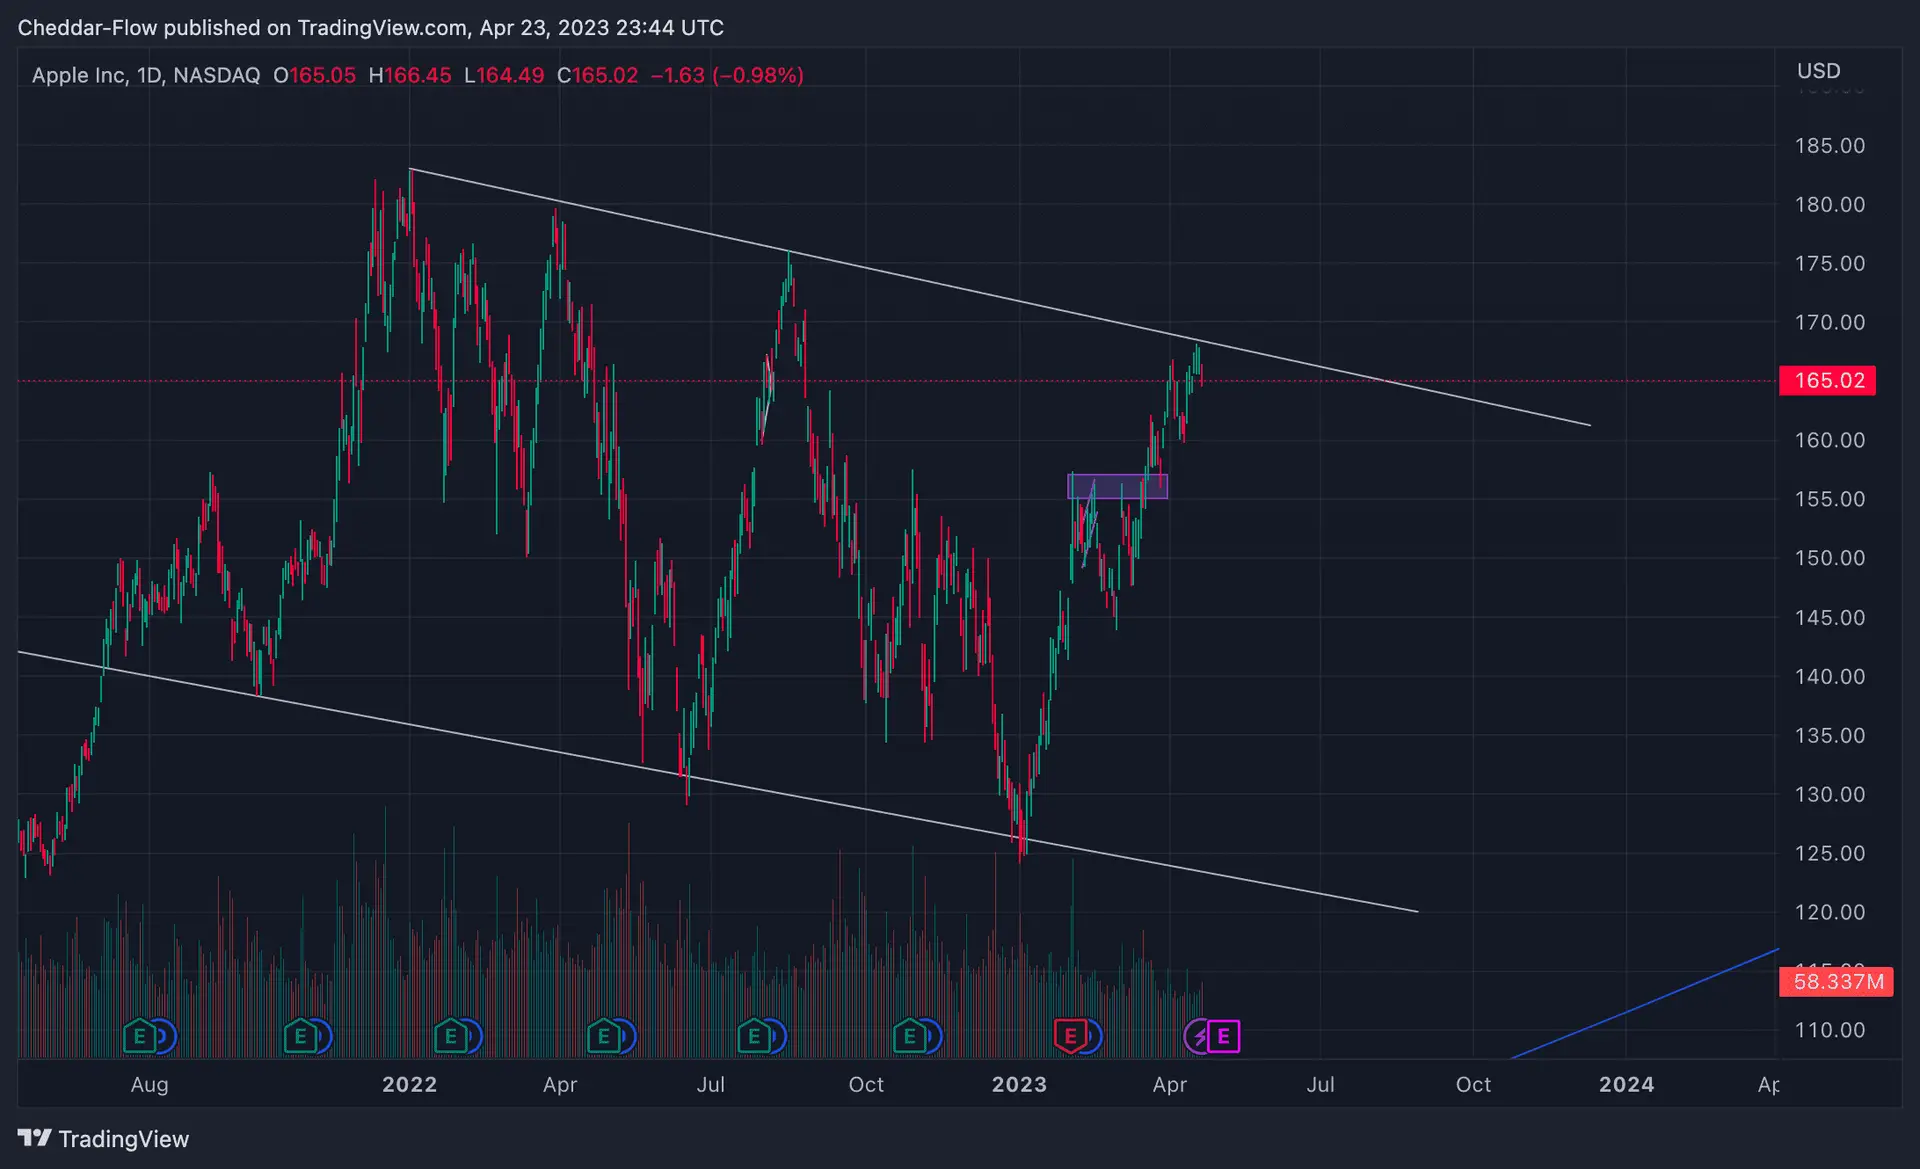
Since its 2023 bottom, Apple’s stock has been on a tear. Moving up $42 or 34% in 4 months. Although the recent rally has been tremendous, $AAPL is finding some tough resistance here at this trendline. Depending on which way the earnings go, we could see Apple’s stock try and break out of this consolidation phase. On a bullish report, look for $APPL to try and get above the $167.5-170 range. On a bearish report, we could see $AAPL get rejected back to the $155-157 range. Remember that the longer a stock consolidates, the more explosive the move up or down can be due to accumulation or distribution.
Apple Key Metrics Preview
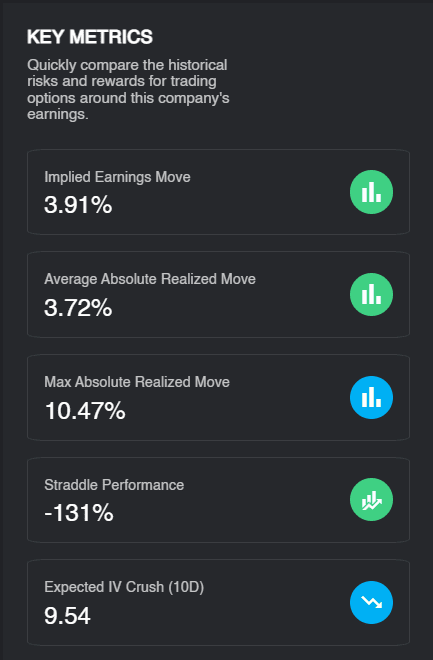
The options market 2 weeks before Apple’s earnings is already implying a 3.9% move post-release. This would be in line with the historical average realized move and less than the 10.4% maximum realized move. You can also see that on average buying a straddle and holding through earnings over the last 4 years would have lost -138%. This also means that there is a theoretical edge by selling volatility through the earnings event, let’s dive in.
Apple Earnings Backtested Data
Seasonal Earnings Move
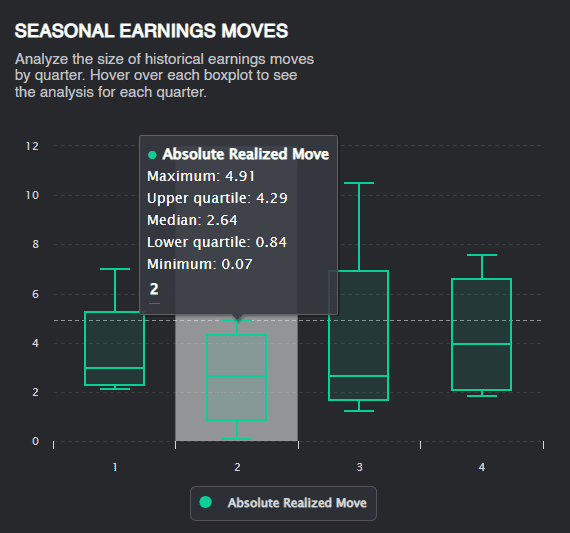
You can see from the chart above that during Q2 results, Apple tends to have the weakest reaction during this quarter both positive and negative. The highest move ever realized during Q2 was 4.91% while the lowest was 0.07%.
Buying Straddles, Puts, and Calls before Earnings
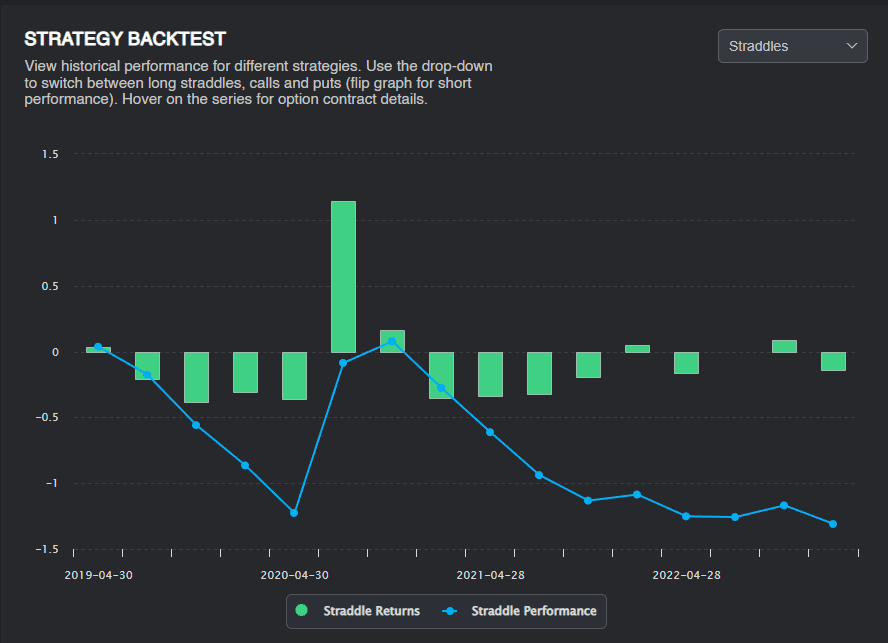
Buying a straddle before the earnings event has historically lost a cumulative -138% over the last 4 years. This also means that selling a straddle before each earnings report would have made 138% on average, over the last 4 years.
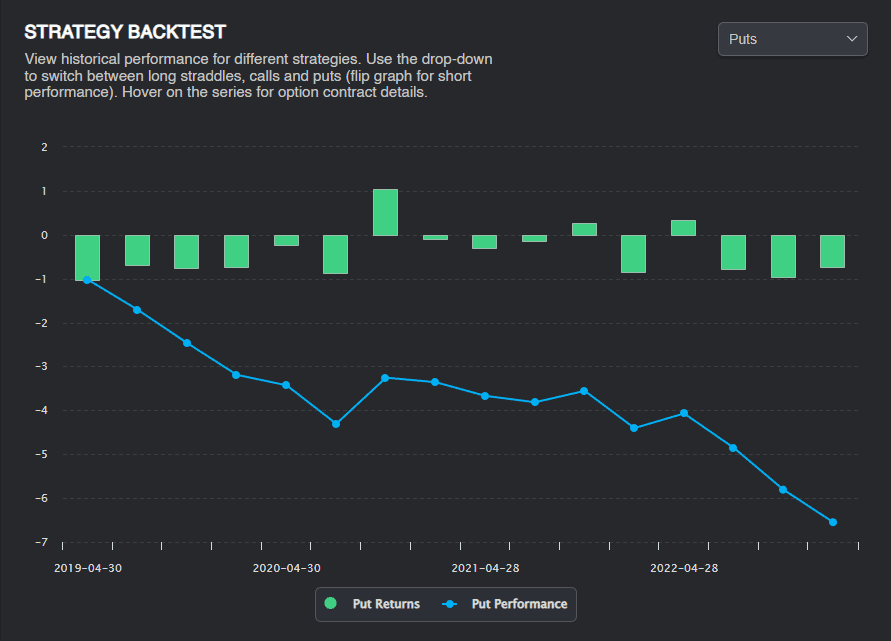
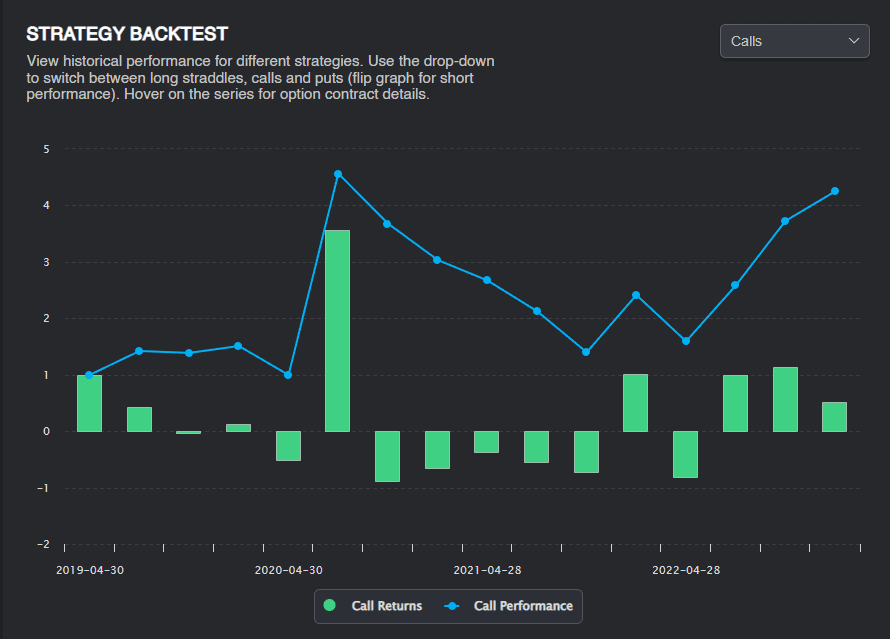
Broken down by puts and calls, you can clearly see that calls have significantly outperformed in comparison to buying puts before each of Apple’s earnings events.
Implied Volatility Before and After
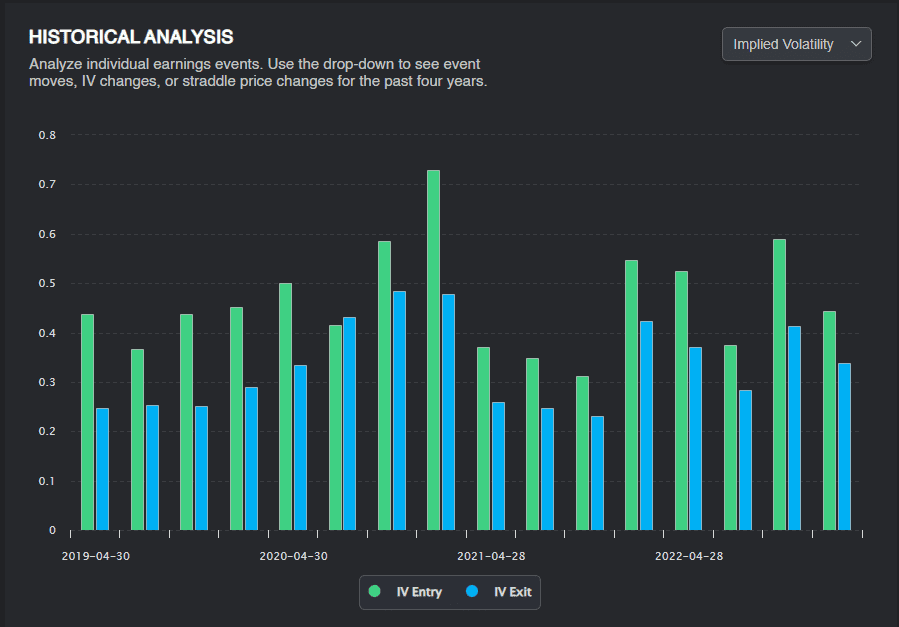
You can see in the chart above that implied volatility (IV) has dropped off after every earnings event besides one in the last 4 years. It’s important to remember that if you are buying options, a drop in IV will reduce the price of an option. If you are selling options, a drop in IV will generally result in a net gain for the options you wrote. This is the term “IV crush” at work.
Apple Earnings Zoomed Out
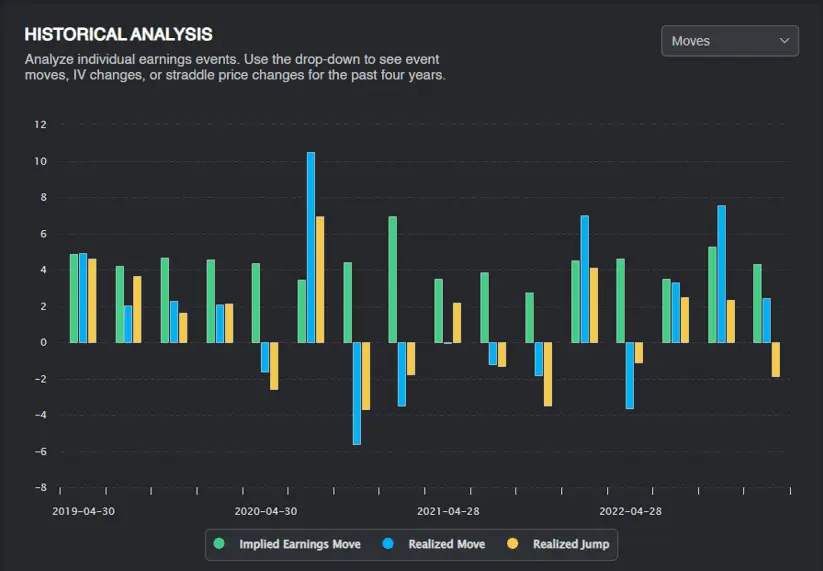
Zooming out, you can see the implied earnings move, the realized move, and the realized jump the next morning for each quarter. This is helpful to determine the historical reaction to Apple’s earnings. Combining the backtested data with the implied earnings move can help a participant gauge where to place the strikes of a trade.
Options Order Flow and Dark Pool Insights
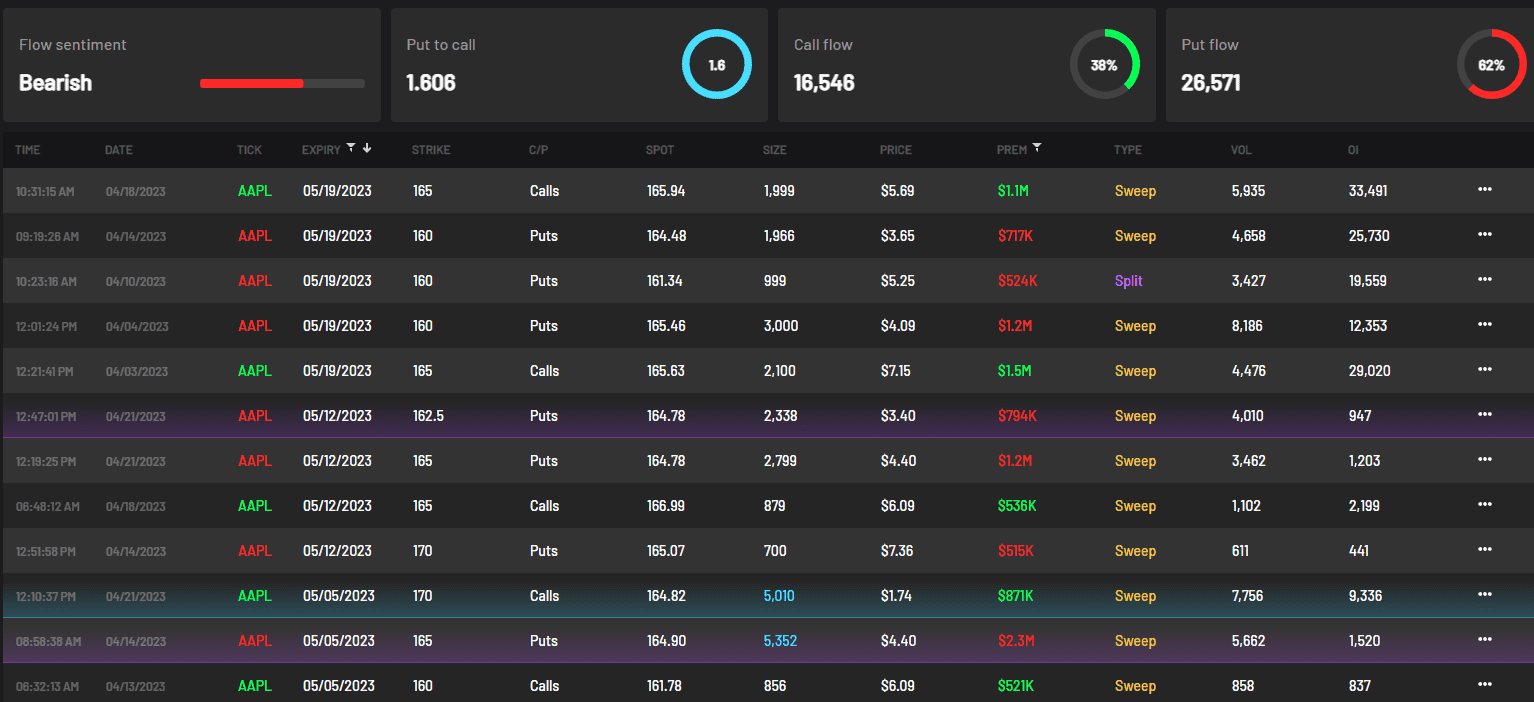
Taking a look at the largest options order flow since April, you can see that puts outweigh calls by a small margin. Because Apple is the largest stock in the S&P 500 and institutional investor’s portfolios, it is tough to draw a conclusion here if this is your standard downside hedging or directional bets.
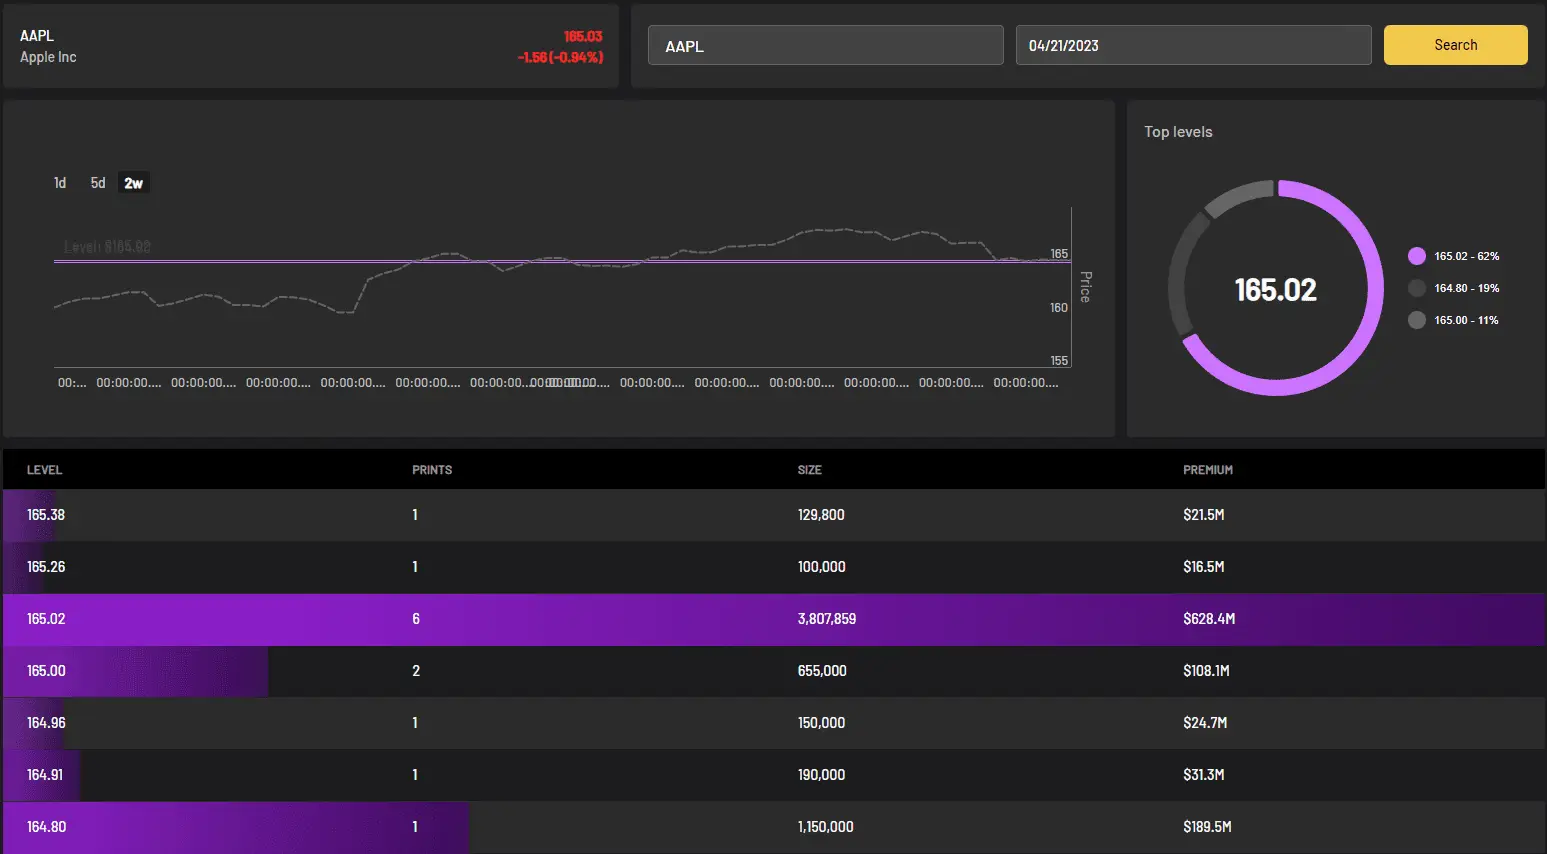
You can see from the Dark Pool print on April 21st, 2023 there was $628 million worth of shares traded at the $165.02 level. Make sure to mark that level on your chart.
Trading Strategies For Apple Earnings
The average implied earnings move for Apple is 4.36%. Currently, the implied earnings move is 3.91%. Already the options market is anticipating near the average realized move of 3.72%. This is most likely due to the fear from last quarter’s earnings miss. Whether your personal view might be bearish, neutral, or bullish, let’s go over some trading strategies for Apple’s earnings on May 4th.
Calendar Spread
A calendar spread is a directionally neutral and risk-defined strategy if buying the spread at the money. It can also be structured with a bullish or bearish bias depending on the strikes chosen. Calendar spreads profit from the passage of time (theta decay) on the front-month option while the back-month option serves as essentially the hedge. This is because further dated options experience less theta decay. You enter the trade with a net debit so they are much better for margin requirements and efficiency than other earnings trade strategies. The goal here is to sell the expensive, short-dated implied volatility while buying a further-dated option with less implied volatility. As the data above pointed out, Apple has experienced a drop in implied volatility post-release for the last 4 years except for one earnings release. If Apple did experience an increase in IV, the spread can still profit if IV changes by the same amount in the short and long options. This is because the further-dated long option has a greater vega than the short one.
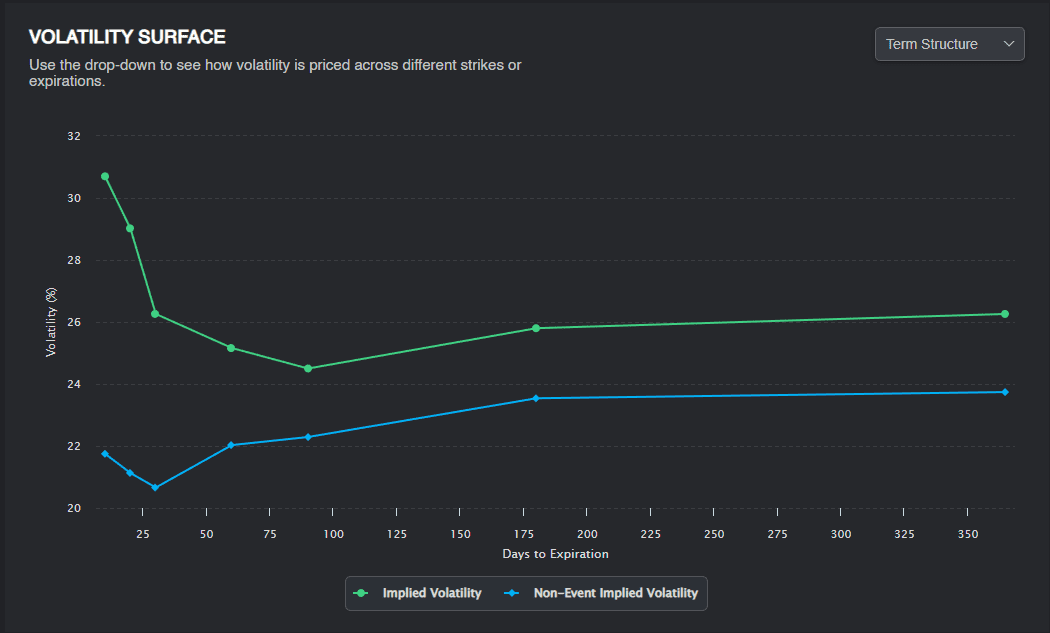
Shown above is the term structure which illustrates that $AAPL is experiencing elevated implied volatility in the short term 10-30DTE. Also visible is the risk premium between event and non-event implied volatility, showing an expected contraction in the volatility post-earnings release.
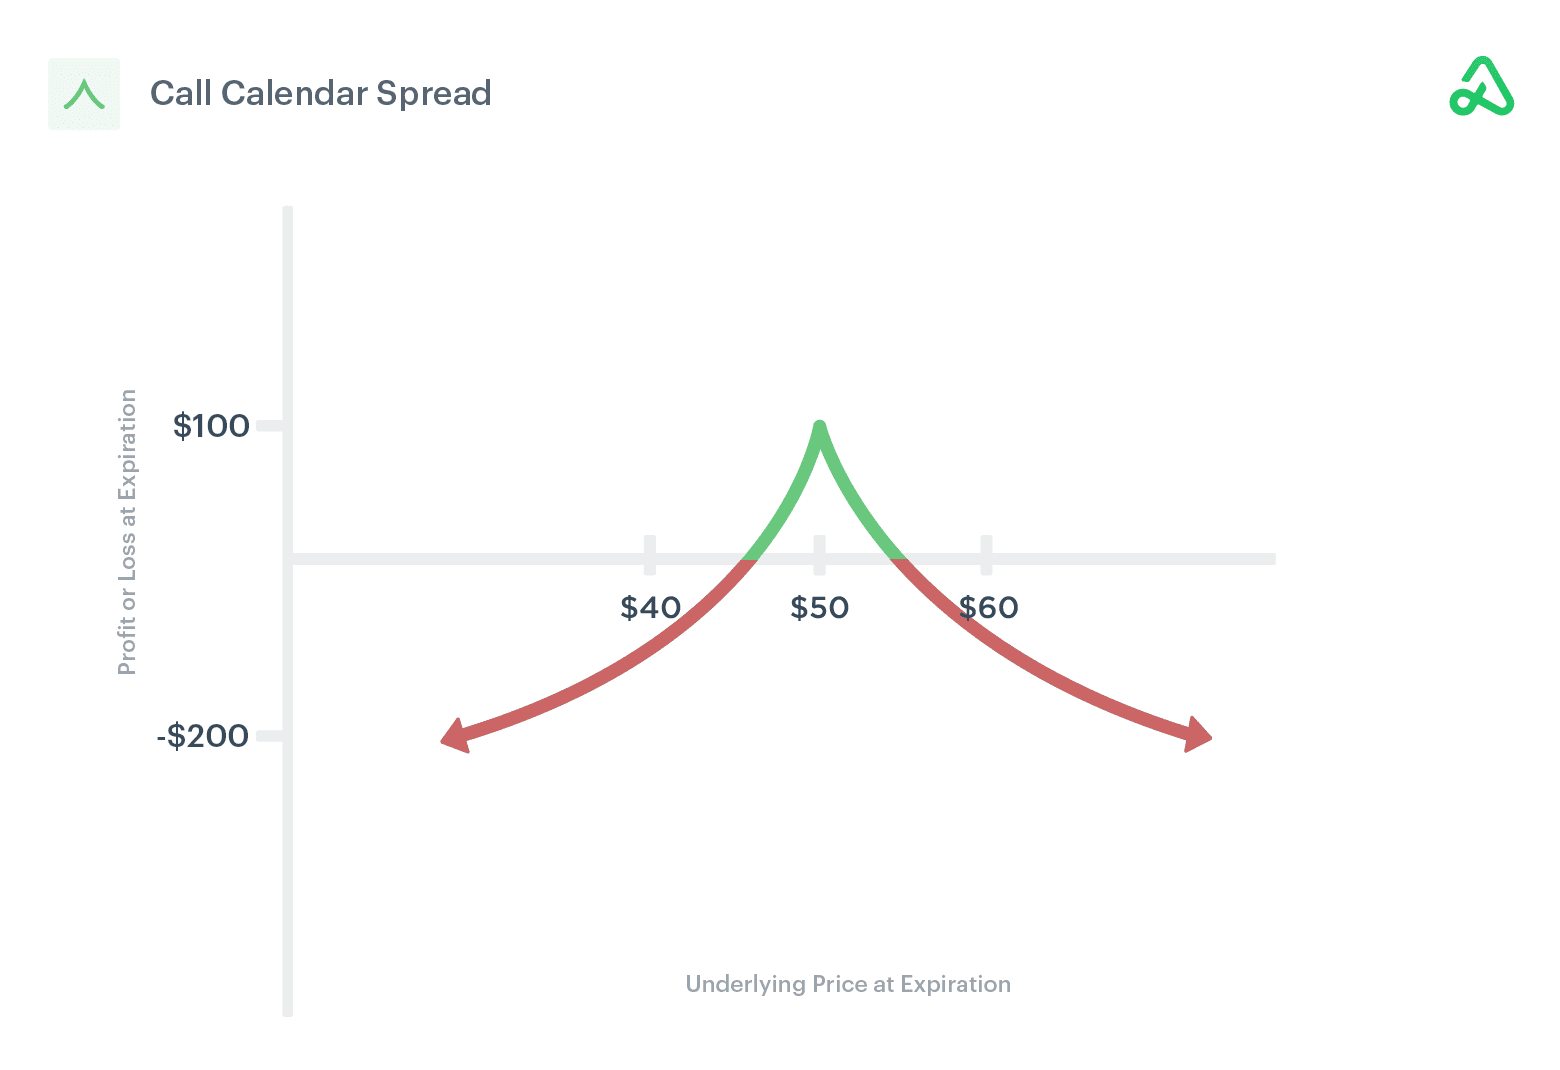
This chart shows that with a neutral, at-the-money calendar spread, Apple will need to stay within the strikes chosen or the trade can suffer losses. This is why depending on your outlook, you can structure the trade with a bearish or bullish bias, leaving room for greater price fluctuations in your preferred direction. It’s important to remember that you always want to take a calendar spread the day of or the day before the earnings report. This is because the closer to the earnings release the higher IV will be and you want to capture the most premium-rich options.
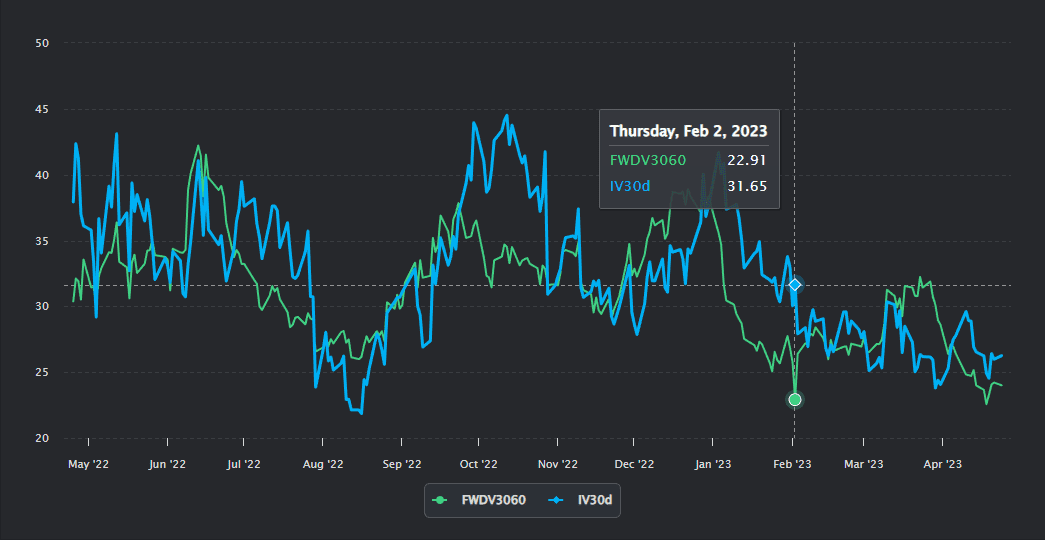
The core metric behind a calendar spread is known as forward volatility. It allows you to understand where the market expects volatility to go between expirations. Above is a chart of IV30 and FWDVOL30/60. Highlighted on the chart is where these metrics were before Apple’s last earnings release on Feb 2nd. Currently, you will notice a gap between the two, which will become wider as we approach earnings on May 4th. This is what we want to see for a successful calendar spread trade.
Iron Condor
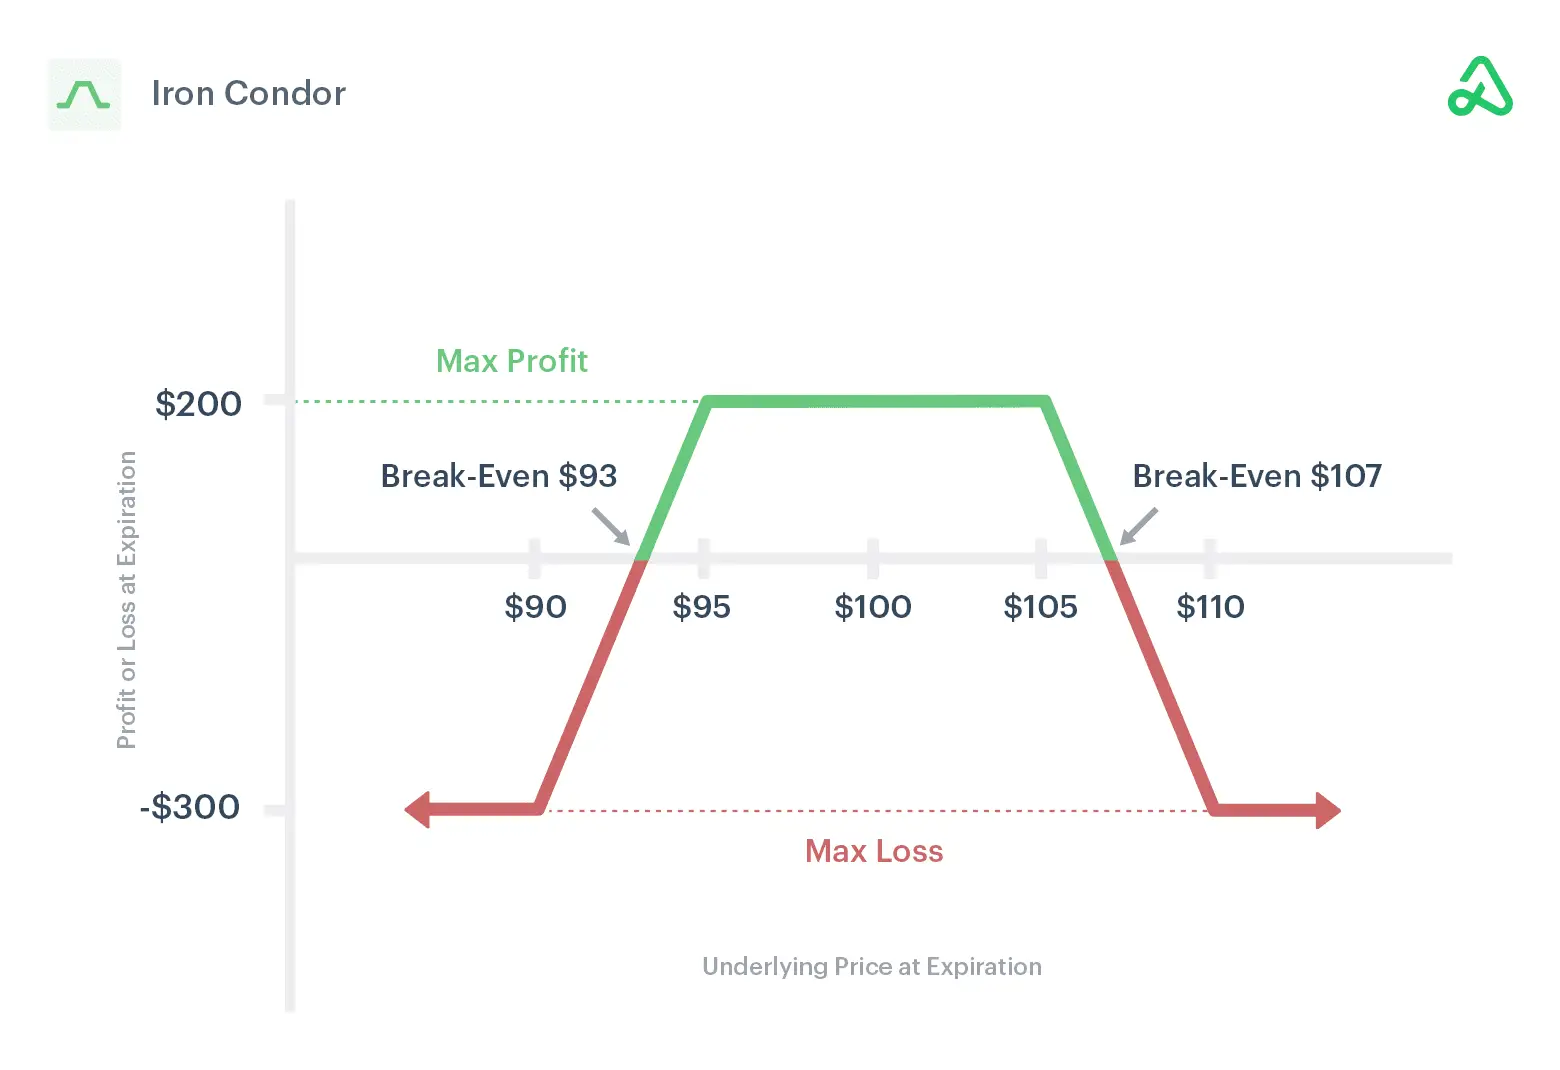
In the key metrics you can see that buying and holding a straddle over the last 4 years of $AAPL earnings has lost an average of -138%. It also means that selling a straddle would have returned a 138% gain. If you believe that Apple’s earnings will produce little to no movement in the share price then an Iron Condor is the best strategy for you. Selling a naked straddle involves high margin requirements and carries unlimited risk. Iron condors are better for margin and can protect the tail risk in case Apple has a positive or negative blowout quarter.
Bullish and Bearish Vertical Spreads
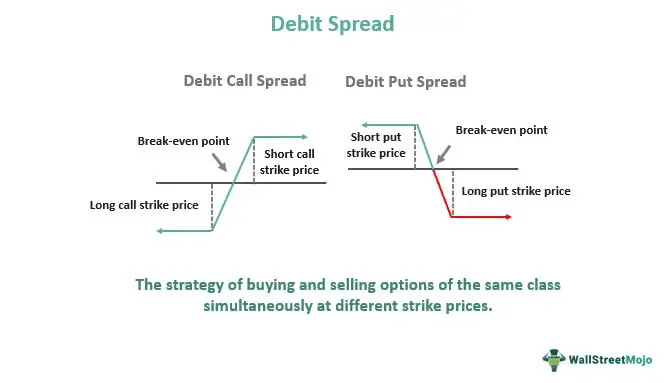
Although you can structure a calendar spread and iron condor with a bias, vertical spreads allow for a more isolated directional bet. Because vertical spreads are done on the same expiration, when the volatility drops, the short option in the spread helps offset the losses of the long option. This makes a vertical spread ideal for a trader who wants to get long gamma for $AAPL earnings.
FOMC Effects on Apple Earnings
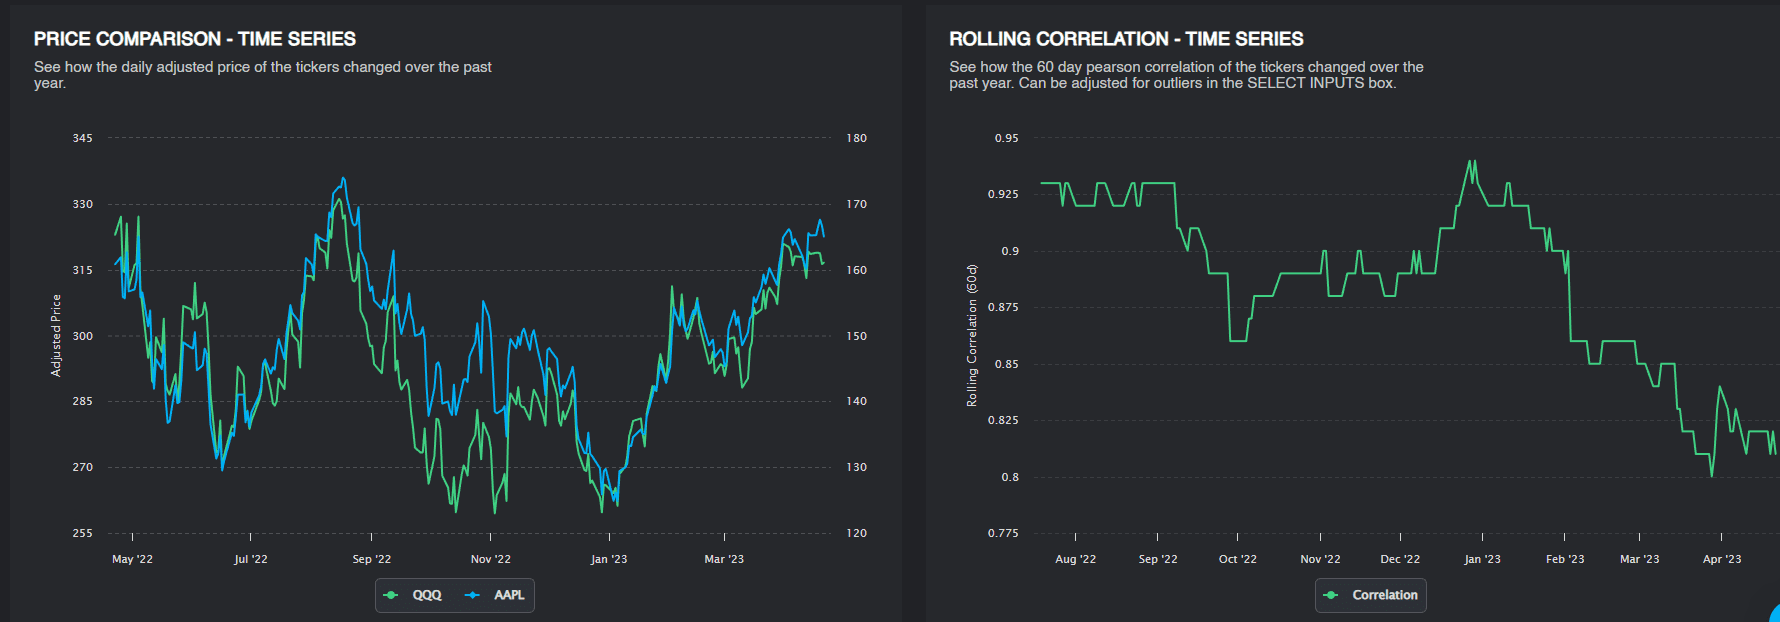
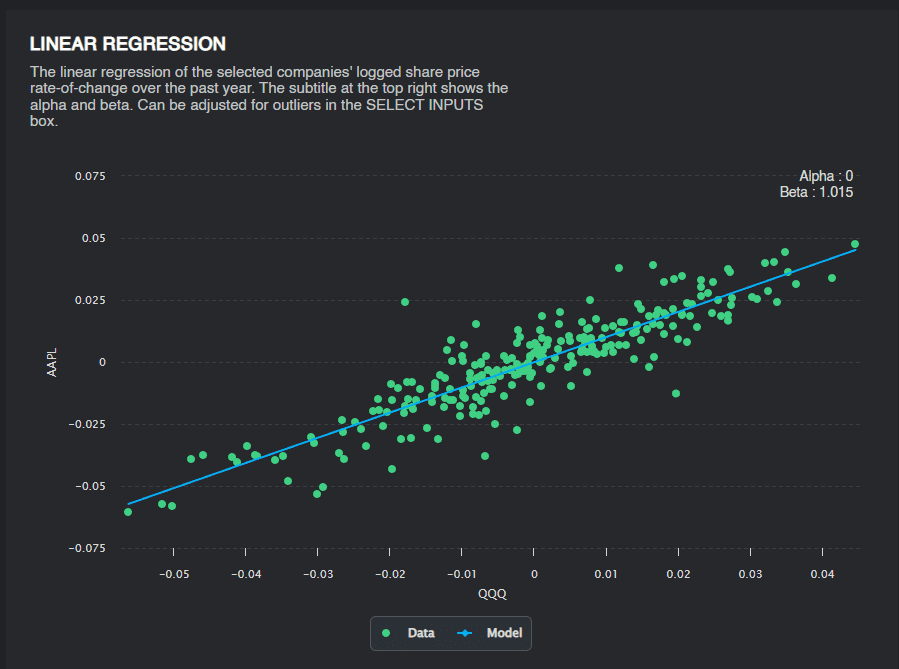
The above charts are showing that $AAPL is highly correlated to the broader tech sector. Apple has a 12.5% weighting on the NASDAQ with a beta right around 1. FOMC is on May 3rd and Apple reports earnings on May 4th, the day after FOMC. This means that implied volatility will be extremely elevated on the day of Apple’s earnings. They will also be the last FAANG stock to report, so all eyes will be watching them. Because of this, there will be fantastic trading opportunities present.
Bonus Chart
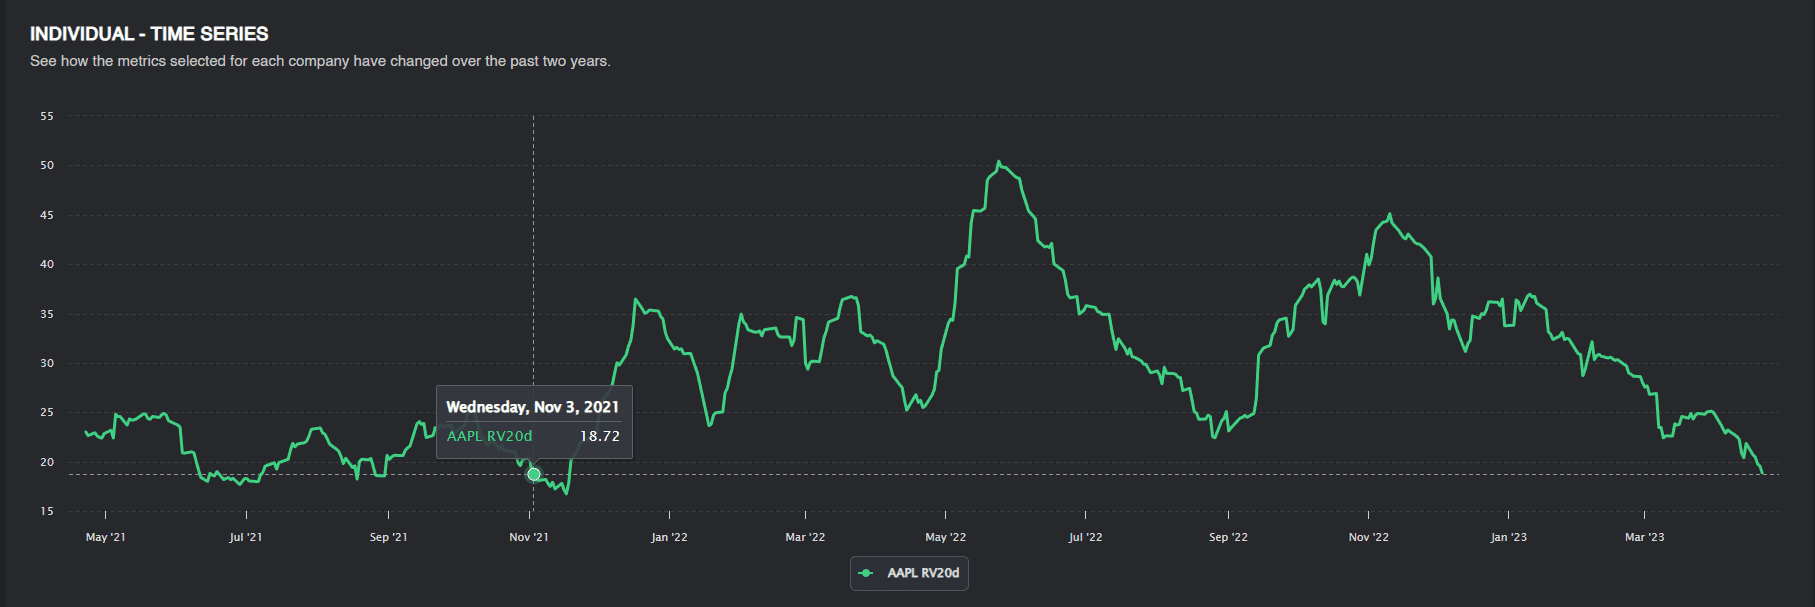
Apple’s 20-day realized volatility dates back to November 3rd, 2021.
Conclusion
Given the macroeconomic headwinds and the poor forecasted device sales, it will be difficult to see Apple significantly beating earnings. With this, we would expect to hear that Tim Cook will be optimistic about the sales and growth in India, along with launching their new high-yield savings account. The question to be foreseen is how much of this will be priced in. The poor Q1 results combined with FOMC is causing implied volatility to dramatically increase and therein lies spectacular trading opportunities. Apple’s upcoming earnings report will further solidify the bull or bear case in these daunting market conditions. All eyes are on Apple.
Charts provided by PredictingAlpha. Disclaimer: Cheddar Flow is not a registered investment advisor nor is licensed as such with any federal or state regulatory agency. Cheddar Flow does not manage client assets in any way. Information provided and opinions expressed on this website do not constitute investment advise. The ideas expressed on this site and related services are solely the opinions of Cheddar Flow and are for educational purposes only. We advise everyone to know the risks involved with trading stocks and options. We encourage every visitor to the website to do his/her own research and to consult with his/her own financial advisor(s) prior to engaging in any investing activities, and to make sure he/she knows all the potential risks involved. Any investment decision that results in losses or gains made based on any information on this site or related services is not the responsibility of Cheddar Flow. Cheddar Flow is solely a data-provider and not a stock picks alert service.