The stock market doesn’t just rise and fall – it also quivers with anticipation. The Cboe Volatility Index (VIX), often called Wall Street’s “fear gauge”. It measures expected volatility in the S&P 500 over the next 30 days . But the VIX is only part of the story. Equally important is the vix futures curve, which shows how volatility expectations change over time.
In this comprehensive guide, we’ll review what the VIX is, what the VIX futures curve represents and what it means when this curve inverts. We will also revisit a dramatic 2018 episode when trade-war fears flipped the curve upside down. Finally, we’ll discuss what an inverted curve signals for traders and investors, complete with charts for clarity.
What Is the VIX (Volatility Index)?
Before diving into futures, let’s pin down the basics of the VIX itself. The VIX is a benchmark index that represents the market’s expectations of near-term volatility in U.S. stocks . In simpler terms, it estimates how turbulent traders expect the S&P 500’s price swings to be over the next month. Calculated from S&P 500 index option prices, the VIX spikes when investors frantically buy protective puts during market turmoil, and it stays low during calm periods. Because it tends to surge when stocks dive, the VIX is widely known as the market’s “fear gauge,” reflecting the level of anxiety or complacency in the market.
For example, a VIX value of 15 suggests relatively low volatility (roughly a 15% annualized change expected), whereas a VIX of 30+ indicates significant fear and large daily swings. Historically, the VIX hovers in the teens during stable times. However, external shocks – like financial crises or geopolitical events – can send it soaring (it even spiked above 80 during the 2008 and 2020 market panics). In essence, the VIX provides a real-time snapshot of market sentiment around risk.
What Is the VIX Futures Curve?
While the VIX index measures current 30-day volatility expectations, VIX futures allow traders to lock in volatility expectations for future months. The collection of prices for these futures across various expiration dates is what we call the VIX futures curve. Plotting VIX futures prices from the front-month contract out to contracts expiring several months ahead creates a curve. This curve shows how the market expects volatility to evolve over time.
In normal conditions, the VIX futures curve slopes upward from left to right – a condition known as contango. This means near-term VIX futures trade at lower prices than longer-dated futures . Contango is common because, most of the time, volatility is expected to revert toward a higher long-run average. When the VIX index is very low (signaling calm markets), traders anticipate it will eventually drift up, so later-dated volatility futures are priced higher. In other words, the market expects more uncertainty in the distant future than in the immediate term.
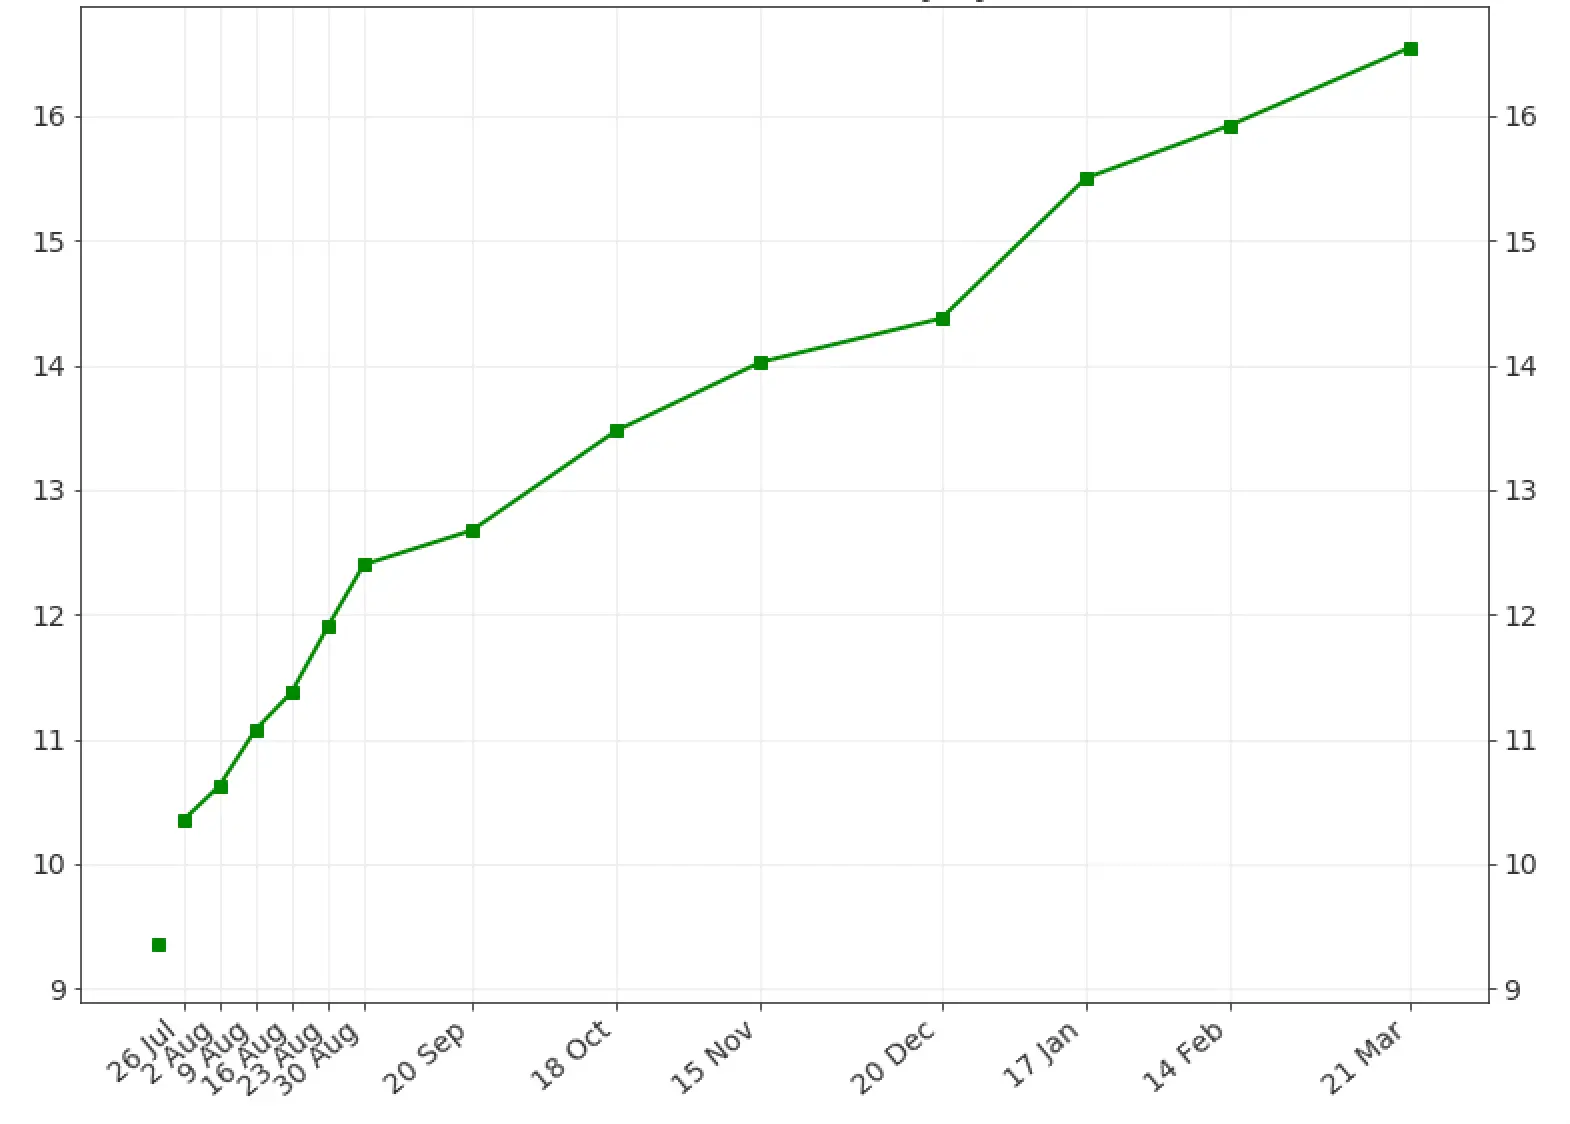
Example of a normal VIX futures curve in contango (upward sloping). Here, the front-month contract is priced around 10 and later months rise into the mid-teens. This indicates traders expect volatility to increase over the coming months.
This upward-sloping structure has important implications. It creates a “roll yield” for volatility traders: holding a short volatility position (betting on calm markets) can be profitable when the curve is in contango. This is so because futures prices tend to drift down toward the spot VIX as expiration approaches. Many volatility exchange-traded products (ETPs) take advantage of this typical contango structure – but only as long as it persists. Sometimes, however, the curve’s shape dramatically changes.
What Is an Inverted VIX Futures Curve?
An inverted VIX futures curve occurs when the usual shape flips. In other words, near-term VIX futures become more expensive than longer-term futures, making the curve slope downward (also called backwardation). This inversion is relatively rare and usually happens during periods of acute market stress. Essentially, traders anticipate more risk right now than a few months down the line. If contango suggests calm now and uncertainty later, backwardation signals “stormy weather” in the immediate forecast, and calmer markets later on.
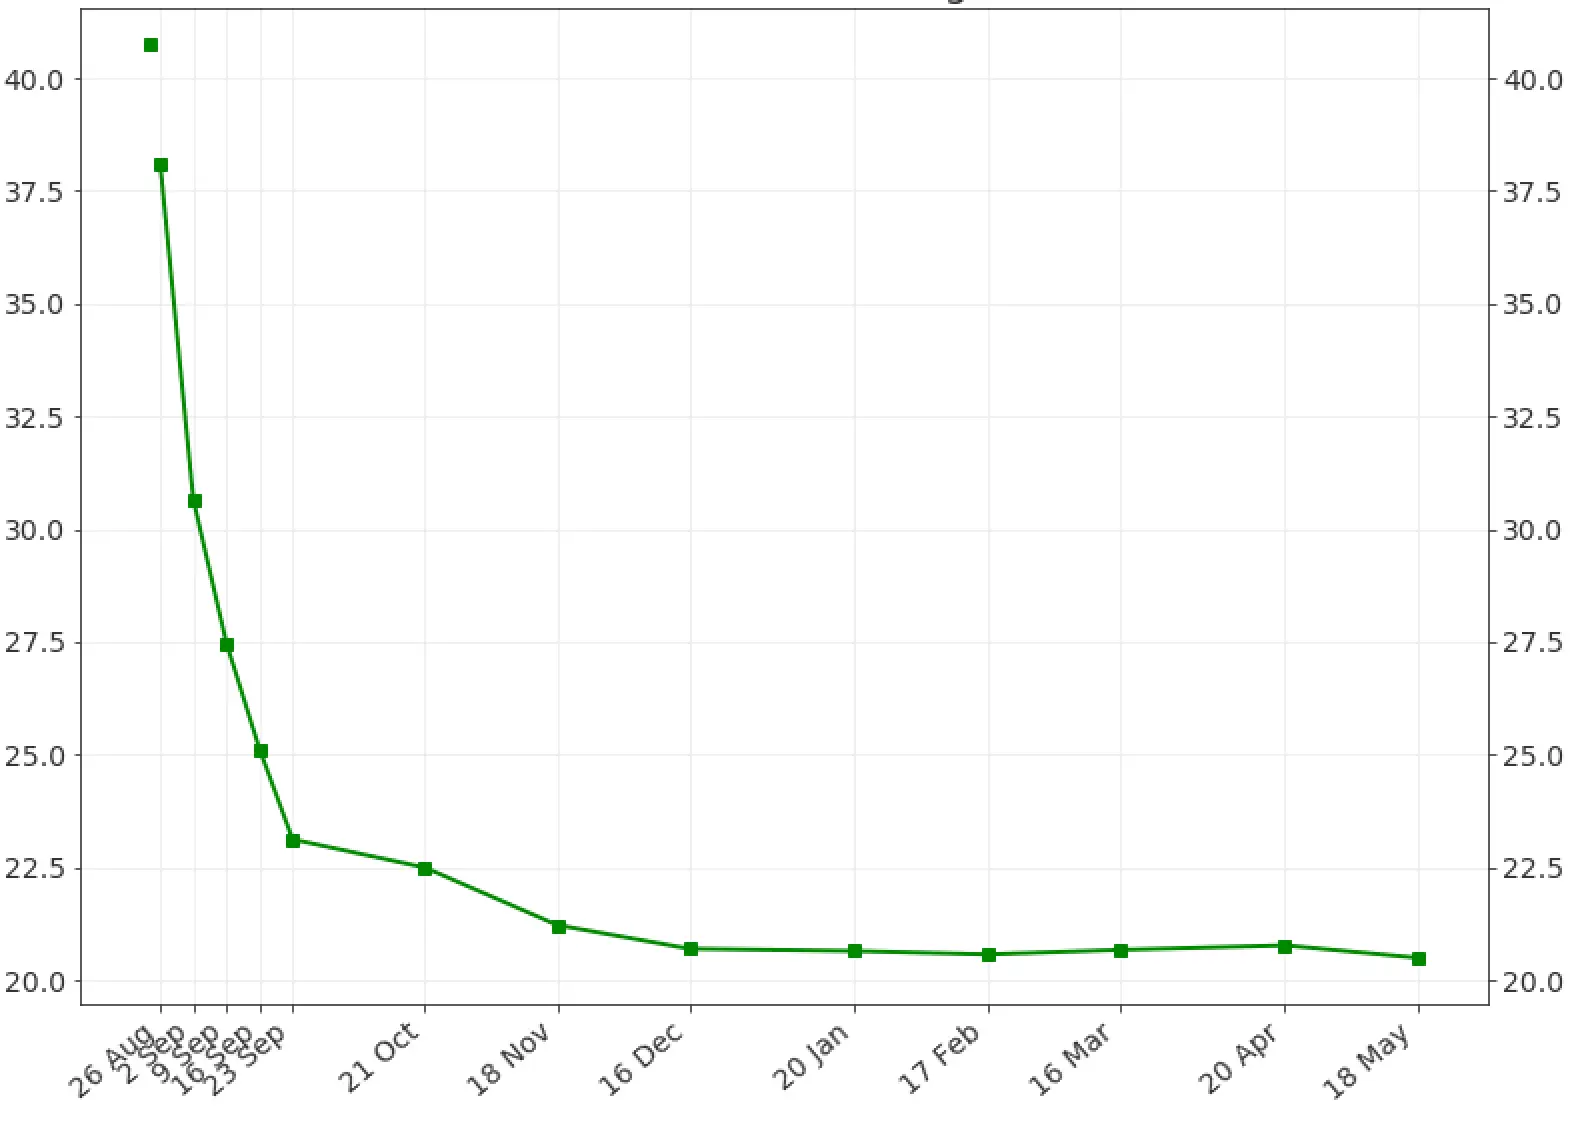
Example of an inverted VIX futures curve (backwardation) during a market shock.
When the VIX futures curve inverts, it’s a telltale sign that near-term fear is running high. The front-month VIX future trading above later months indicates traders are scrambling for protection against immediate turmoil, driving up short-term volatility prices. Such an inverted curve “signals intense near-term market stress” and a surge in demand for short-term hedges like put options. Put simply, the market is saying the next few weeks look perilous, but conditions might calm down a bit further out.
This condition typically doesn’t last long. Historically, VIX backwardation has been short-lived, often lasting only days or weeks around a crisis. It marks points of peak fear – for example, during surprise geopolitical events or rapid market corrections. In fact, a burst of backwardation often coincides with market bottoms in a correction, as panic climaxes and then begins to ease. However, in an ongoing bear market, backwardation can recur or persist in waves, reflecting sustained uncertainty . Either way, an inverted VIX curve is a critical warning sign that volatility is here, right now – and it demands attention.
Case Study: When Tariff Fears Inverted the VIX Futures Curve
To understand these concepts in action, let’s revisit early 2018, when a sudden trade policy surprise sent shockwaves through markets. In March 2018, U.S. President Donald Trump announced sweeping tariffs on major U.S. trading partners – including broad duties on steel and aluminum imports. This aggressive move toward protectionism caught investors off-guard and sparked fears of a global trade war. World markets tumbled in reaction, with industrial stocks plunging as traders braced for retaliatory moves from China, Europe, and others. Similarly, Trump’s recent pledge to impose reciprocal tariffs on major trading partners jolted markets, sparking instant fears of an escalating global trade war.
The spike in uncertainty was palpable. The VIX shot up into the mid-20s as tariff headlines hit newswires. On March 22, 2018 China retaliated against U.S. tariff plans. Consequently, the VIX surged to 24.87 at the close, its highest in over a month. In the days surrounding these announcements, short-term volatility expectations drastically outpaced longer-term expectations, causing the VIX futures curve to turn sharply inverted.
In practical terms, traders were saying that the next month or two would be much riskier than the rest of the year. Demand for immediate downside protection (puts and short-term volatility futures) exploded, driving near-term VIX futures prices above those expiring further out. Such inversion is a clear signal of market anxiety – everyone wants insurance now, not later.
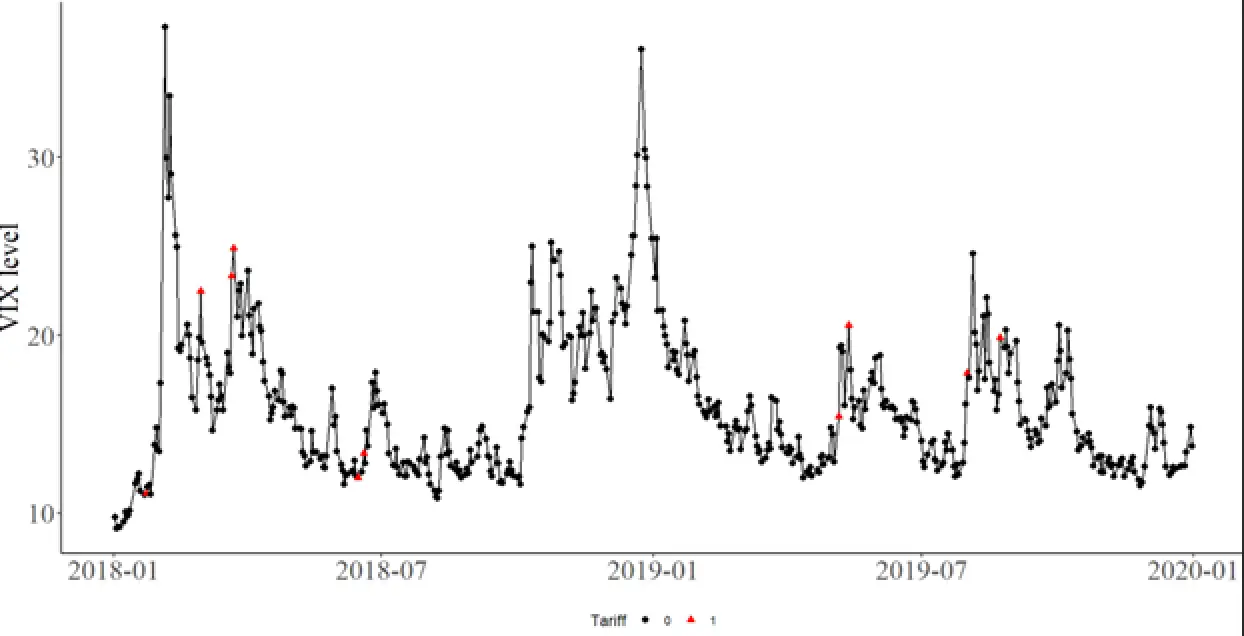
The VIX Index (black line) spiked multiple times in 2018 amid trade war news. These volatility spikes were short-lived as calmer conditions returned within weeks.
Implications for Traders and Investors
The 2018 tariff scare was a textbook case of how a sudden crisis can jolt the volatility term structure. Short-term hedging demand skyrocketed (e.g. via S&P 500 put options and VIX futures), and many investors moved to de-risk their portfolios. But importantly, the episode also demonstrated that volatility spikes driven by news can fade quickly if the worst fears don’t materialize. Within a couple of weeks, markets found their footing as trade negotiations got underway. Soon after, the VIX receded and the futures curve reverted to its customary contango slope.
Long-term investors took away a clear directive: stay calm, but get prepared. Sudden volatility shocks underscore the importance of diversification and hedging when things are calm. So when the storm hits—say, a sudden tariff shock—you stay ready, not blindsided. Traders who read the VIX futures curve correctly in March 2018 would have recognized the extreme level of near-term fear and possibly taken the opportunity to initiate hedges or reduce risk until the uncertainty passed.
What to Do When the VIX Curve Inverts
An inverted VIX futures curve is essentially the market screaming “danger ahead – buckle up!”. For traders and investors, it’s a cue to adopt a more defensive stance. Here are a few prudent steps to consider when the curve flips into backwardation:
- Reassess Portfolio Exposure: Identify which holdings are most vulnerable to the current source of volatility and consider trimming or hedging those positions .
- Stress-Test Your Allocation: Run scenarios to see how your portfolio would fare if volatility stays elevated or if the market drops further. Ensure your asset mix can weather a period of elevated turbulence without forcing you into fire sales .
- Hedge Your Downside: This could mean buying protective puts on equity positions, increasing cash allocations, or using volatility instruments as insurance. When the VIX futures curve inverts, hedging costs rise. But that also reflects a higher likelihood of near-term payoff from protection.
The key is risk management. An inverted curve serves as a timely reminder that markets can change on a dime. So having a plan to mitigate downside risk is essential. By responding calmly and strategically traders can navigate the storm until the volatility “fever” breaks and the curve normalizes.
Frequently Asked Questions (FAQ)
Q1: How is the VIX futures curve different from the VIX index itself?
A1: The VIX index is a snapshot of current expected volatility over the next 30 days. Whereas the VIX futures curve shows the term structure of volatility expectations over coming months. The index is calculated from option prices and moves in real-time. While futures prices reflect what traders expect the VIX will be at future dates. In short, the VIX is “now,” and the futures curve is “where volatility is expected to go” in the future.
Q2: Why is the VIX futures curve usually upward sloping (in contango)?
A2: In calm markets, the current volatility is low. But traders anticipate that over longer periods, volatility could revert higher (toward its long-run average). This, plus a volatility risk premium, means longer-dated VIX futures often have higher prices . The upward slope (contango) is the norm because it costs more to insure against uncertainty further out in time. Only when there is immediate panic does this flip into backwardation.
Q3: What causes the VIX futures curve to invert?
A3: An inversion (backwardation) happens when there is a sudden surge of fear or uncertainty in the market. In such moments, everyone wants protection right now – bidding up the price of the nearest VIX futures (and the VIX itself) relative to later months. Common triggers include market crashes, geopolitical shocks, or surprise news (e.g. a pandemic outbreak or unexpected policy announcement). Essentially, the front-end of the curve spikes above the back-end because traders believe the current turmoil will ease in a few months.
Q4: How often does the VIX futures curve invert, and is it a bad sign?
A4: VIX backwardation is uncommon and tends to coincide with major market stress. It occurred during the 2008 financial crisis, the 2011 U.S. debt downgrade, the 2015 China scare, the February 2018 volatility shock, the late-2018 sell-off, the March 2020 COVID crash, etc. While it’s certainly a warning sign of near-term risk, it’s not always “bad” in the long run. Often, it marks the climax of fear. In many cases, the stock market found a bottom while the VIX was backwardated, subsequently rallying as volatility subsided. However, one should be cautious: persistent inversion, as seen in prolonged bear markets, means sustained uncertainty.
Q5: Can traders profit from the shape of the VIX futures curve?
A5: Yes, many volatility strategies revolve around the curve’s shape. For instance, some traders earn carry by shorting VIX futures during contango, capturing the roll-down yield as futures prices converge lower toward spot VIX over time. Conversely, if they anticipate backwardation, they might go long volatility (buy VIX futures or call options) to profit from an ongoing surge in fear. Timing is crucial – these trades can be lucrative but also risky. Moreover, volatility ETPs (like VXX or UVXY) and inverse volatility products have performance that is heavily influenced by the curve’s shape. Contango slowly erodes their value, while backwardation provides a tailwind for long-volatility products. Always exercise caution and understand that volatility can turn on a dime.