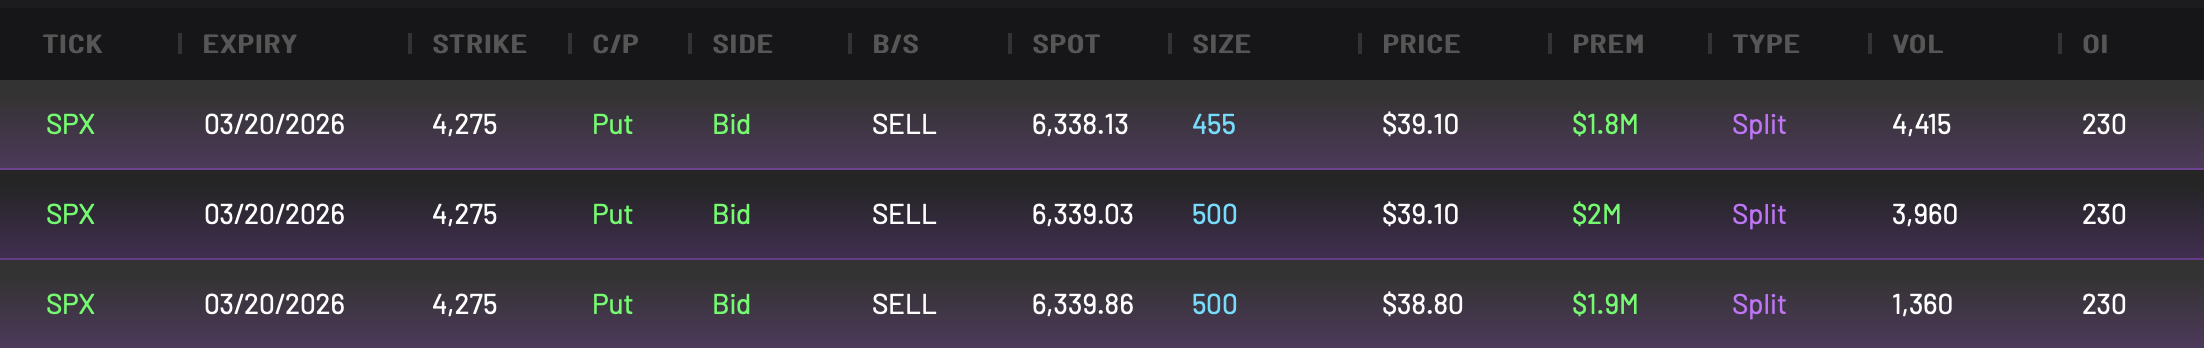
Three large SPX put option trades, all with a strike price of 4,275 and an expiration date of March 20, 2026, showed up on our options flow feed today. All are sell-side trades at the bid, classified as “Split” transactions. The split nature of these trades suggests execution across multiple exchanges or brokers. The spot price at the time ranged from 6,338.13 to 6,339.86. This deems the puts as deep out-of-the-money (OTM) and possibly part of a long-term bullish hedge or speculative position.
Notably, the volume (VOL) for this contract totals 4,415 contracts. Open interest (OI) stood at 230, resulting in a V/OI ratio of 19.2. This is an extremely high figure that signals unusual activity and likely the establishment of new positions. Total premium between the trades adds up to $5.7M, reflecting significant capital deployment. Individual trade sizes varied between 455 and 500 contracts at prices of $39.10 and $38.80 per contract. This cluster of high-premium trades, combined with elevated V/OI and long-dated bearish structure, may suggest institutional hedging or a directional macro bet anticipating strong support around the 4,275 level for the S&P500.
Volume and Open Interest Data
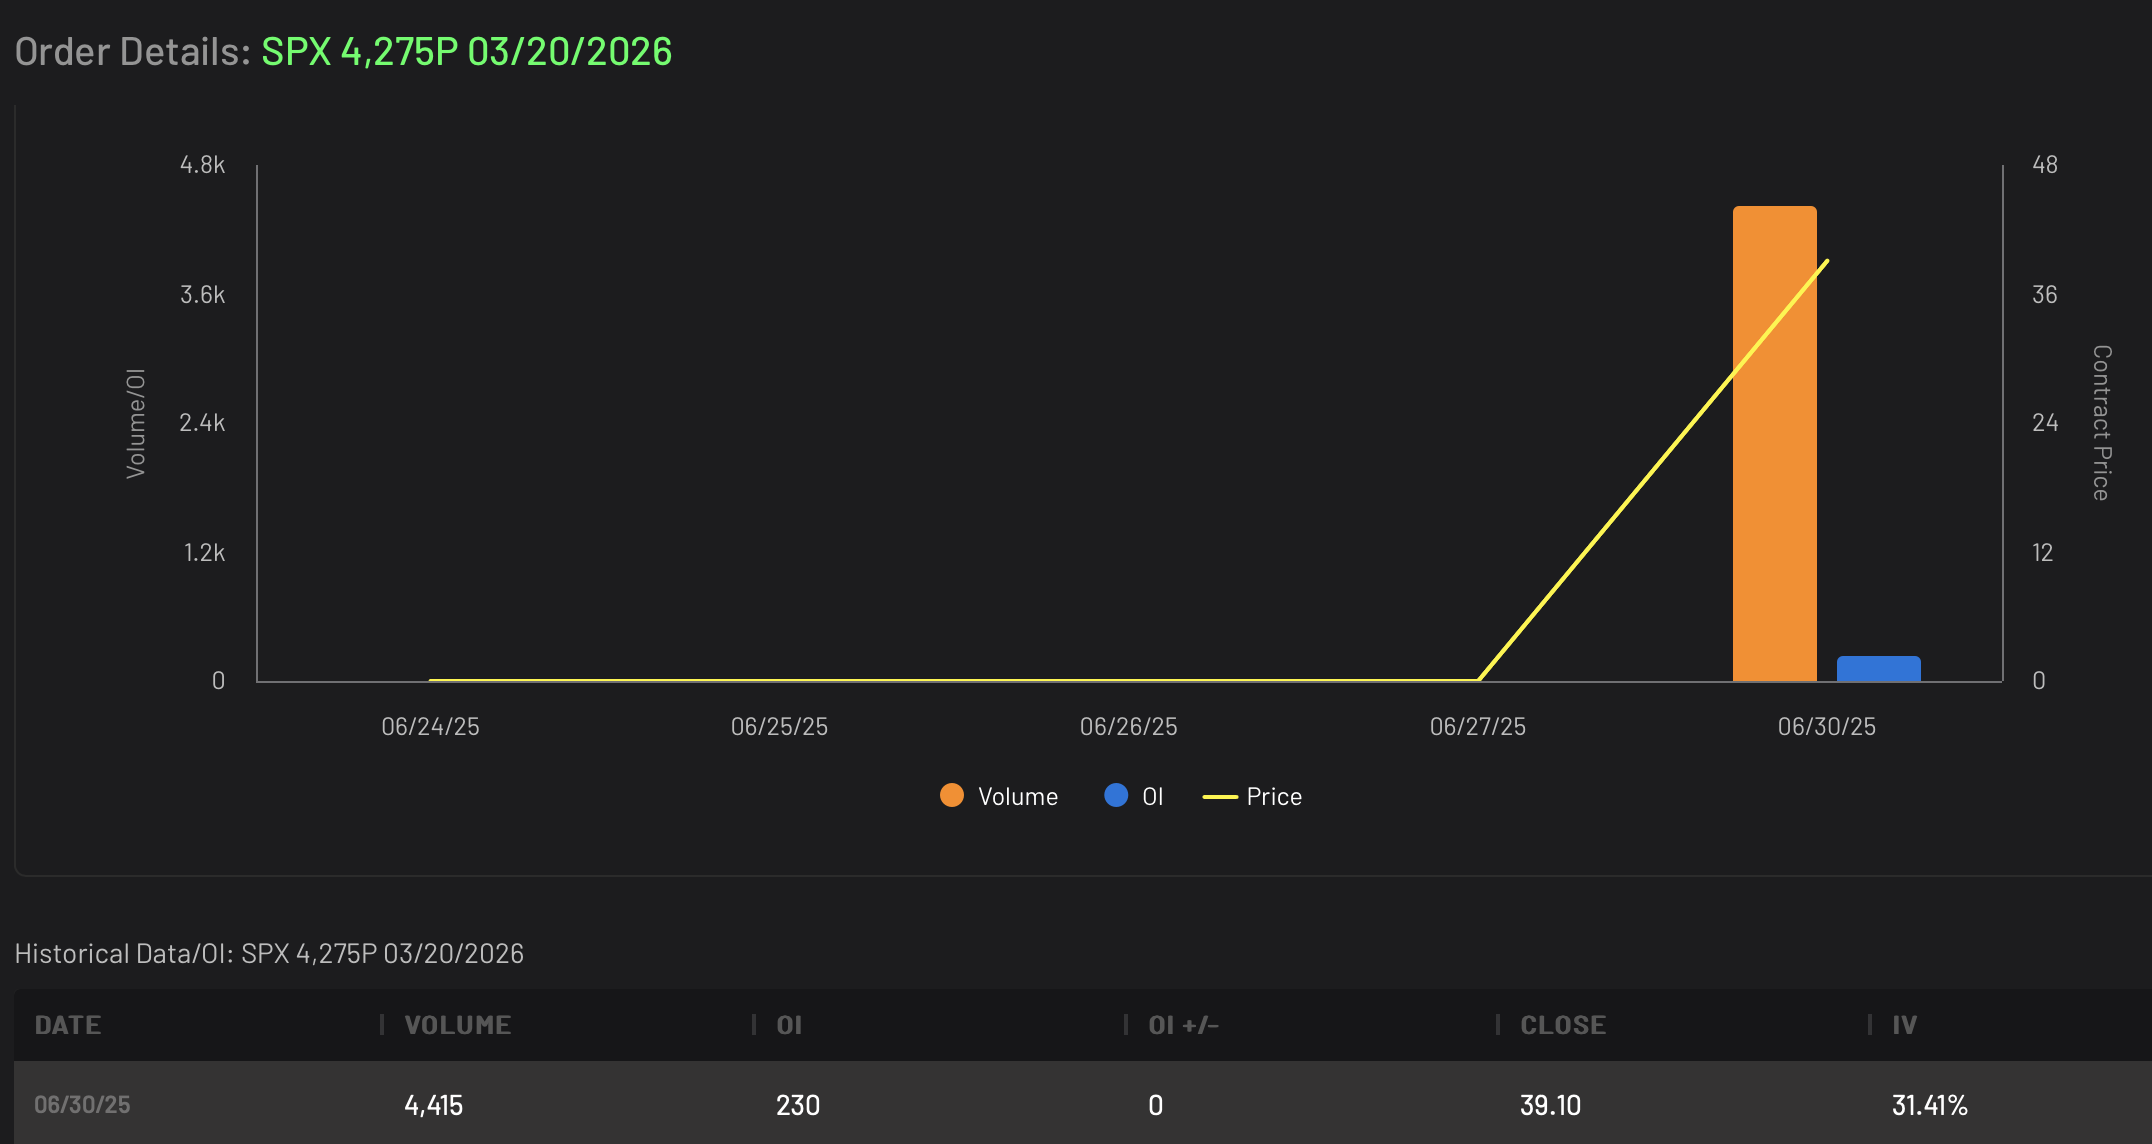
The data table highlights a significant spike in options activity for the SPX 4,275 Put expiring March 20, 2026. On June 30th 2025, the contract recorded an unusually high volume of 4,415 contracts. Open interest (OI) stood muted at 230 contracts. This discrepancy suggests that the entire volume likely represents new positions, rather than the closing or rolling of existing ones.
The closing price of the contract on that day was $39.10, with an implied volatility (IV) of 31.41%. This indicates a modestly elevated market expectation of future movement. The Volume/Open Interest (V/OI) ratio is an extremely elevated 19.2. The ratio further reinforces the view that this is a noteworthy and potentially institutional-sized entry into a bearish position or hedge.
Trade Side Distribution
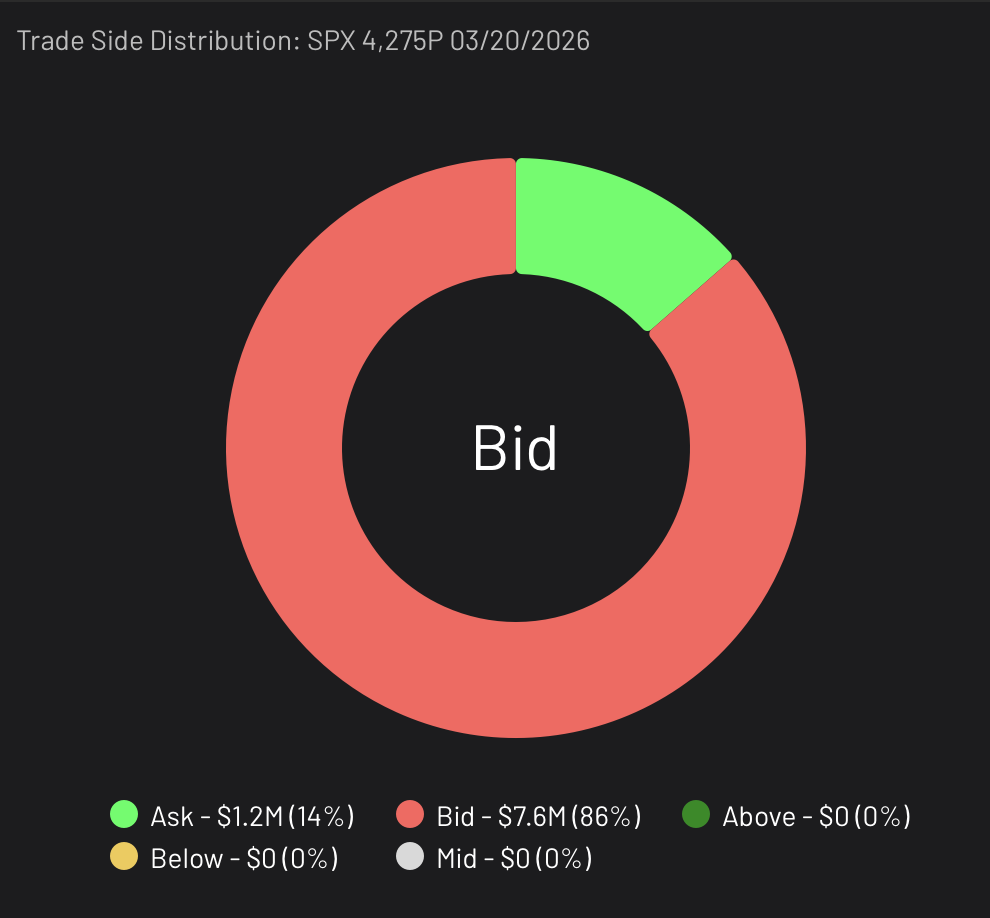
The trade side distribution for the SPX 4,275P expiring March 20, 2026 reveals a clear dominance of sell-side activity. With 86% of the total $8.8 million in premium traded at the bid—amounting to $7.6 million—the skew is clear. Only 14% of the volume ($1.2 million) traded at the ask. No trades occurred at the mid, above, or below market prices.
This breakdown strongly suggests that most of these trades were initiated by sellers. Being as these are puts, this skew signals a strong bullish stance being taken by institutional players or a large-scale hedging strategy. The overwhelming execution at the bid implies that sellers were aggressive and eager to enter the market, adding further weight to the directional intent behind these trades.
More Notable Options Trades Observed

Another notable SPX option trade signaled long-term bullishness. The SPX call option trade for the 6,575 strike, expiring on March 20, 2026. This expiry is the same as the previously analyzed bullish put activity. This trade was a buy order executed above the spot price of 6,343.79. It indicated a bullish directional bet or a potential hedge against upside risk. The trade involved 200 contracts at a premium price of $222.90, totaling a significant $4.5 million in premium.
With volume at 204 and open interest at 2,441, the V/OI ratio is low (approximately 0.08). The ratio implies that this is not an instance of new interest, but rather adding to an existing position or rolling. The classification as a “Split” order further suggests that this trade was executed across multiple venues or as part of a larger, complex strategy. Overall, this trade reflects large-scale bullish exposure with substantial capital committed.
What’s Happening with the S&P500
The S&P 500 surged to a new all-time record high today. It closed above previous peak levels and signaling continued strength in the U.S. equity markets. Fueled by optimism around resilient economic data, easing inflation pressures, and strong performance from mega-cap tech stocks, investor sentiment remained firmly bullish.
The benchmark index pushed past its earlier highs as traders priced in expectations of potential rate cuts later in the year, combined with robust corporate earnings and ongoing momentum in AI-driven sectors. Today’s breakout marks a key milestone in the market’s recovery and underscores investor confidence in the long-term growth trajectory of the U.S. economy.
About the S&P500
The S&P 500 Index represents the 500 largest publicly traded companies in the U.S. across various sectors. The index offers investors broad exposure to the U.S. equity market. This makes it a popular tool for both long-term investment strategies and short-term trading. Known for its high liquidity, tight bid-ask spreads, and deep options market, the S&P500 serves as a key instrument for hedging, speculation, and benchmarking overall market sentiment.
Want to see more of these trades? Try out Cheddar Flow free for 7 days. Learn More
Disclaimer: Options trading involves significant risk and is not suitable for all investors. You may lose the entire investment, and certain strategies may result in losses exceeding the initial amount invested. Past performance does not guarantee future results. This content is for informational purposes only and should not be considered investment advice. Always consult a financial or tax advisor before making investment decisions.