What are unusual options?
Unusual Options Activity involves option contracts being traded at a much higher volume than their daily average. Large volume on option contracts can indicate that someone is making a bet based on transparent or non-transparent catalysts.
A transparent catalyst is a public event like an earnings call, company conference, or a product launch event. These events are known by the general public and traders may have proprietary information that they use to place an unusual option order.
Non-transparent catalysts involve events that are not scheduled or made known to the public. These can be an early release of earnings, a company acquisition, an executive leaving, etc. Traders and investors that have this non-public information may be making a large bet using unusual option activity.
Characteristics of unusual options activity
There are several characteristics that are specific to unusual options activity, specifically:
- Daily volume of an option contract is much higher than average (can be 5-10 times higher than average)
- Majority of the daily volume of an option contract is from one very large trade (indicates large concentration)
For example, the TSLA $730 Call Option with 04/30 expiry has an average daily volume of 9,000 contracts. If the volume on that option contract reaches 50,000 on one of the days, that means someone is placing a big bet on the direction of TSLA in the short term.
Using Cheddar Flow we can look at the individual option orders placed and if we see that the 50,000 contracts were largely made using one or two orders, then that’s a big indication of unusual options activity.
Furthermore, it’s even better to look for unusual options activity that involve:
- Weekly option expiration (or some short term period)
- Far Out of The Money (OTM) options
When unusual options activity shows up for weekly OTM options it’s a strong signal that someone knows something since they’re expecting a very large movement in the underlying stock price over a very short period of time (by the time of expiration).
Tips on trading unusual options activity
Unusual options activity can also be a hedge
We’ve discussed the characteristics of unusual options activity and how they can represent a big bet on the underlying price of the stock. But it’s also important to know that unusual option activity can also be used by institutions as a hedge to combat short term fluctuations in stocks. We need to remember that institutions own a large portion of the stock market and they often hold their positions for long periods of time.
However, institutions also track annual returns and short term fluctuations in the stock prices can heavily decrease their returns. Since institutions own such large positions, it can be difficult to liquidate or buy back positions if they are expecting volatility in the short term. As an alternative it’s much easier to purchase a hedge than liquidate and buy back large positions.
For example, let’s assume that a fund has a high ownership in Tesla and that the company is hosting an investor day which could result in short term volatility. Instead of reducing the position size to mitigate short term risk, the fund can purchase a high number of far OTM put options as a hedge which would be detected as an unusual option activity.
If the investor day is received well by the market and Tesla’s stock price goes up, the institution would benefit from holding on to their stock position but would simply lose the premium they spend on the OTM put options.
If the event causes a big decrease in Tesla’s stock price, the institution would lose on their stock position in the short term while booking a profit on their far OTM put options (if the stock price decreased enough within the expiry date). This example illustrates that unusual options activity should be used along with other indicators to understand if these trades are bets on the direction of the stock or are simply acting as hedges.
Look for high volume fluctuations
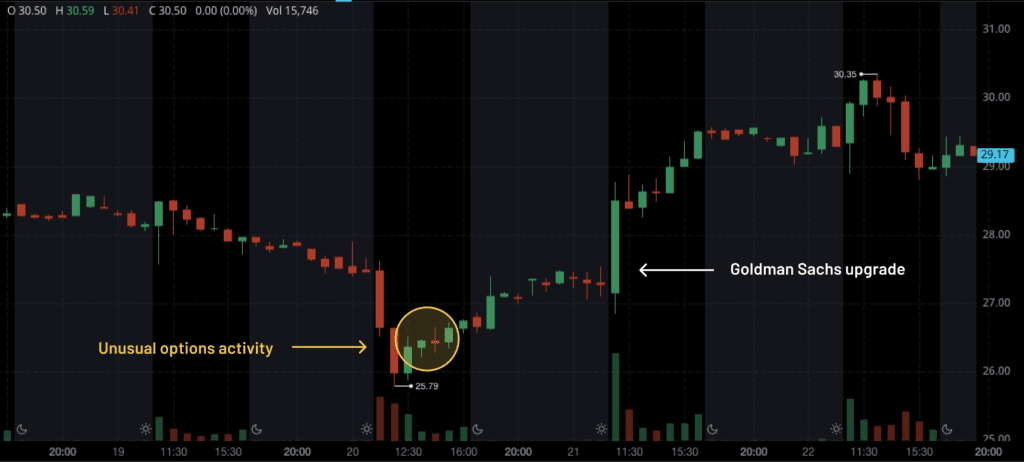
To better understand unusual options activity and how it’s used to bet on the direction of the underlying stock, let’s look at an example using Cheddar Flow. In the screenshot below we see that someone placed a large call order for the NCLH $29.5 strike with 05/21 expiry date.

This is an unusual option for the following reasons:
- Volume of option contracts is much higher than average daily volume. We see this by looking at the ration between volume/open interest. In this case it’s 500 which indicates a very high relative volume in this option contract
- Volume of this option contract accounts for the majority of the daily volume. In this case the size of this option contract is 500 which is the majority of the daily volume of 502
Some of the other characteristics we discussed were also displayed in this trade:
- Expiration date is 05/21 which is one month out from the date of this trade. Even though it’s not a weekly expiration, a one month expiration is still considered a short term option contract
- Strike price is 10-15% OTM which is considered pretty far OTM since it requires a large change in the underlying stock price
So now that we identified this unusual option activity, we can use other indicators to confirm this is a bullish bet. Cheddar Flow has tools for chart analysis, dark pool activity, and the ability to search for all other option activities made for a specific ticker symbol.
On April 21, Goldman Sachs upgraded NCLH to buy from neutral which resulted in a 10.3% pop in the stock. This is an example of a non-transparent catalyst since the stock upgrade wasn’t a public event. However, the investor or trader making this large bet may have known about this upgrade ahead of time.

Use filters to identify unusual options activity
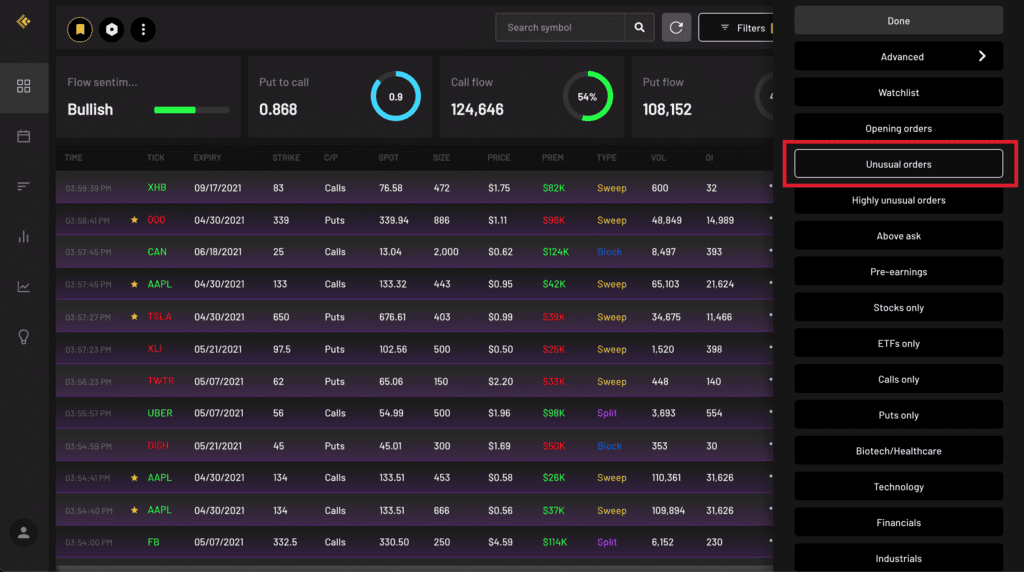
Cheddar Flow has a few other great features to help with identifying unusual options activity. Specifically, the ability to filter trades based on “Unusual orders” and “Highly unusual orders”.
These orders are highlighted in purple and blue to help visually identify unusual orders that are worth looking into. These orders are flagged as unusual based on volume and urgency which are key characteristics of unusual option activity.

Conclusion
To recap, below are some of they key points we touched on:
- Unusual options activity involves option orders with large relative volume
- They can represent a bet on the direction of the underlying stock in the short term
- Unusual options activity can also be used as a hedge, therefore it’s best to use in combination with other indicators to understand the potential direction of the stock
- Cheddar flow offers filtering options to identify unusual options activity along with other tools to analyze these trades


