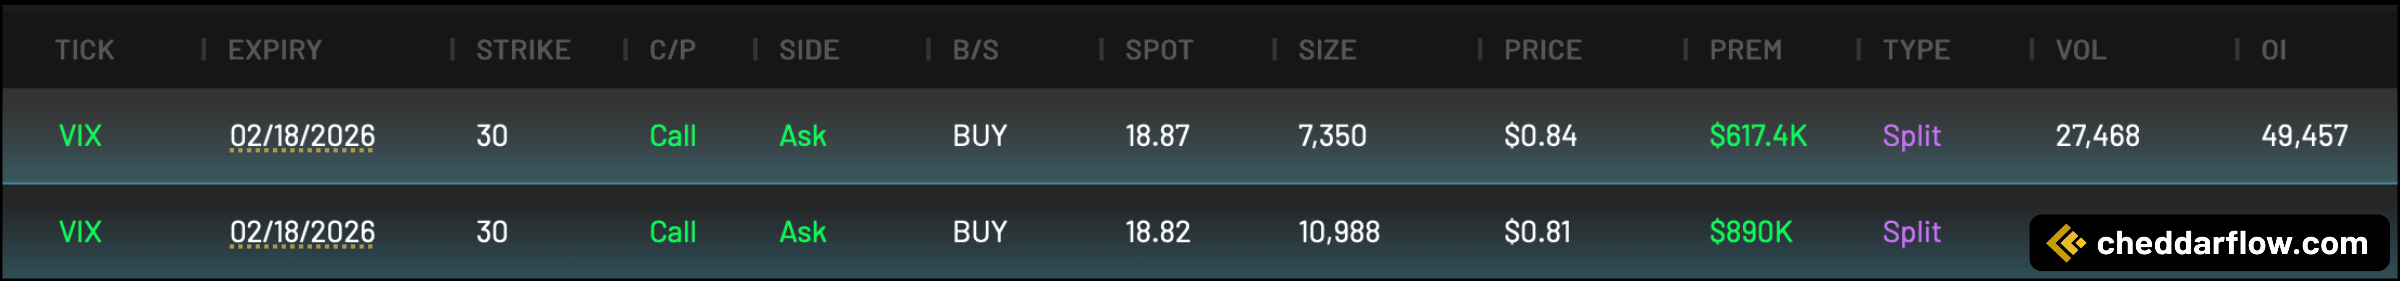
Today we detected two large and unusual VIX February 18, 2026 $30 call purchases executed on the ask, indicating aggressive positioning on volatility. Focusing on the top trade, total daily volume came in at 27,468 contracts at the time of the trade. Against open interest of 49,457, this results in a V/OI ratio of ~0.56. This is notable because more than half of existing open interest traded in a single session. This suggests meaningful new positioning rather than routine churn.
The contracts were bought while VIX spot was around 18.9, placing the $30 strike deep out-of-the-money. This reinforces the idea of tail-risk hedging or a volatility spike thesis rather than a short-term trade. The premium paid on the top print was approximately $617K and $890K for the second. This confirms institutional-sized risk allocation. With roughly 50 days until expiration, traders are positioning for volatility into mid-February, potentially around macro, geopolitical, or market-structure catalysts. Overall, the combination of ask-side execution, elevated V/OI, sizable premium, and long-dated OTM strike points to deliberate and conviction-driven volatility protection.
Volume and Open Interest Data
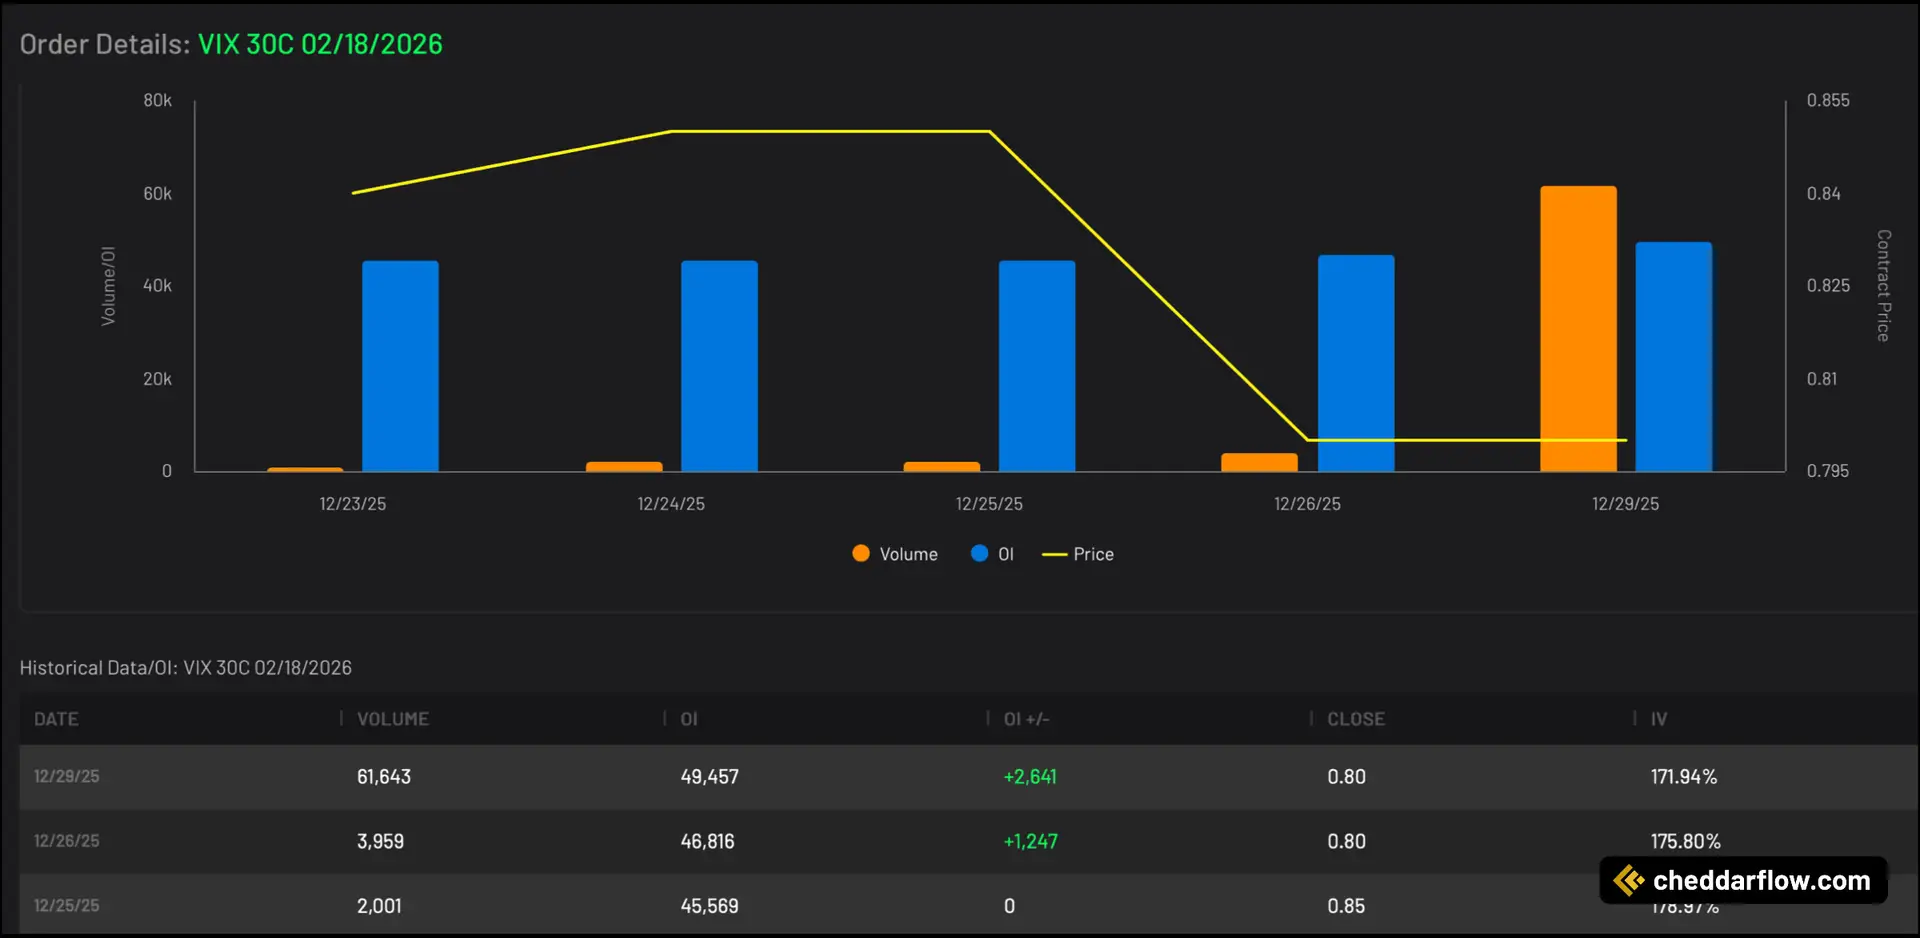
The volume and open interest data for the VIX February 18, 2026 $30 calls shows a clear escalation in positioning. A significant surge on 12/29/25 confirms this culmination. On that day, volume spiked to 61,643 contracts versus open interest of 49,457, producing a V/OI ratio of ~1.25. This is a strong signal that new positions were aggressively opened rather than just traded against existing interest. Open interest increased by +2,641 contracts from the previous session, confirming fresh risk being added.
Notably, this surge occurred while the option price declined to ~$0.80 from ~$0.85, suggesting buyers were willing to accumulate size even as pricing softened. This is often indicative of institutional hedging or scaling into long volatility exposure. Implied volatility remains extremely elevated (~172% IV), reinforcing that this is a high-conviction volatility trade. Overall, the data points to deliberate accumulation of long-dated, deep OTM VIX calls, consistent with tail-risk protection or anticipation of a future volatility regime shift rather than short-term speculation.
Trade Side Distribution
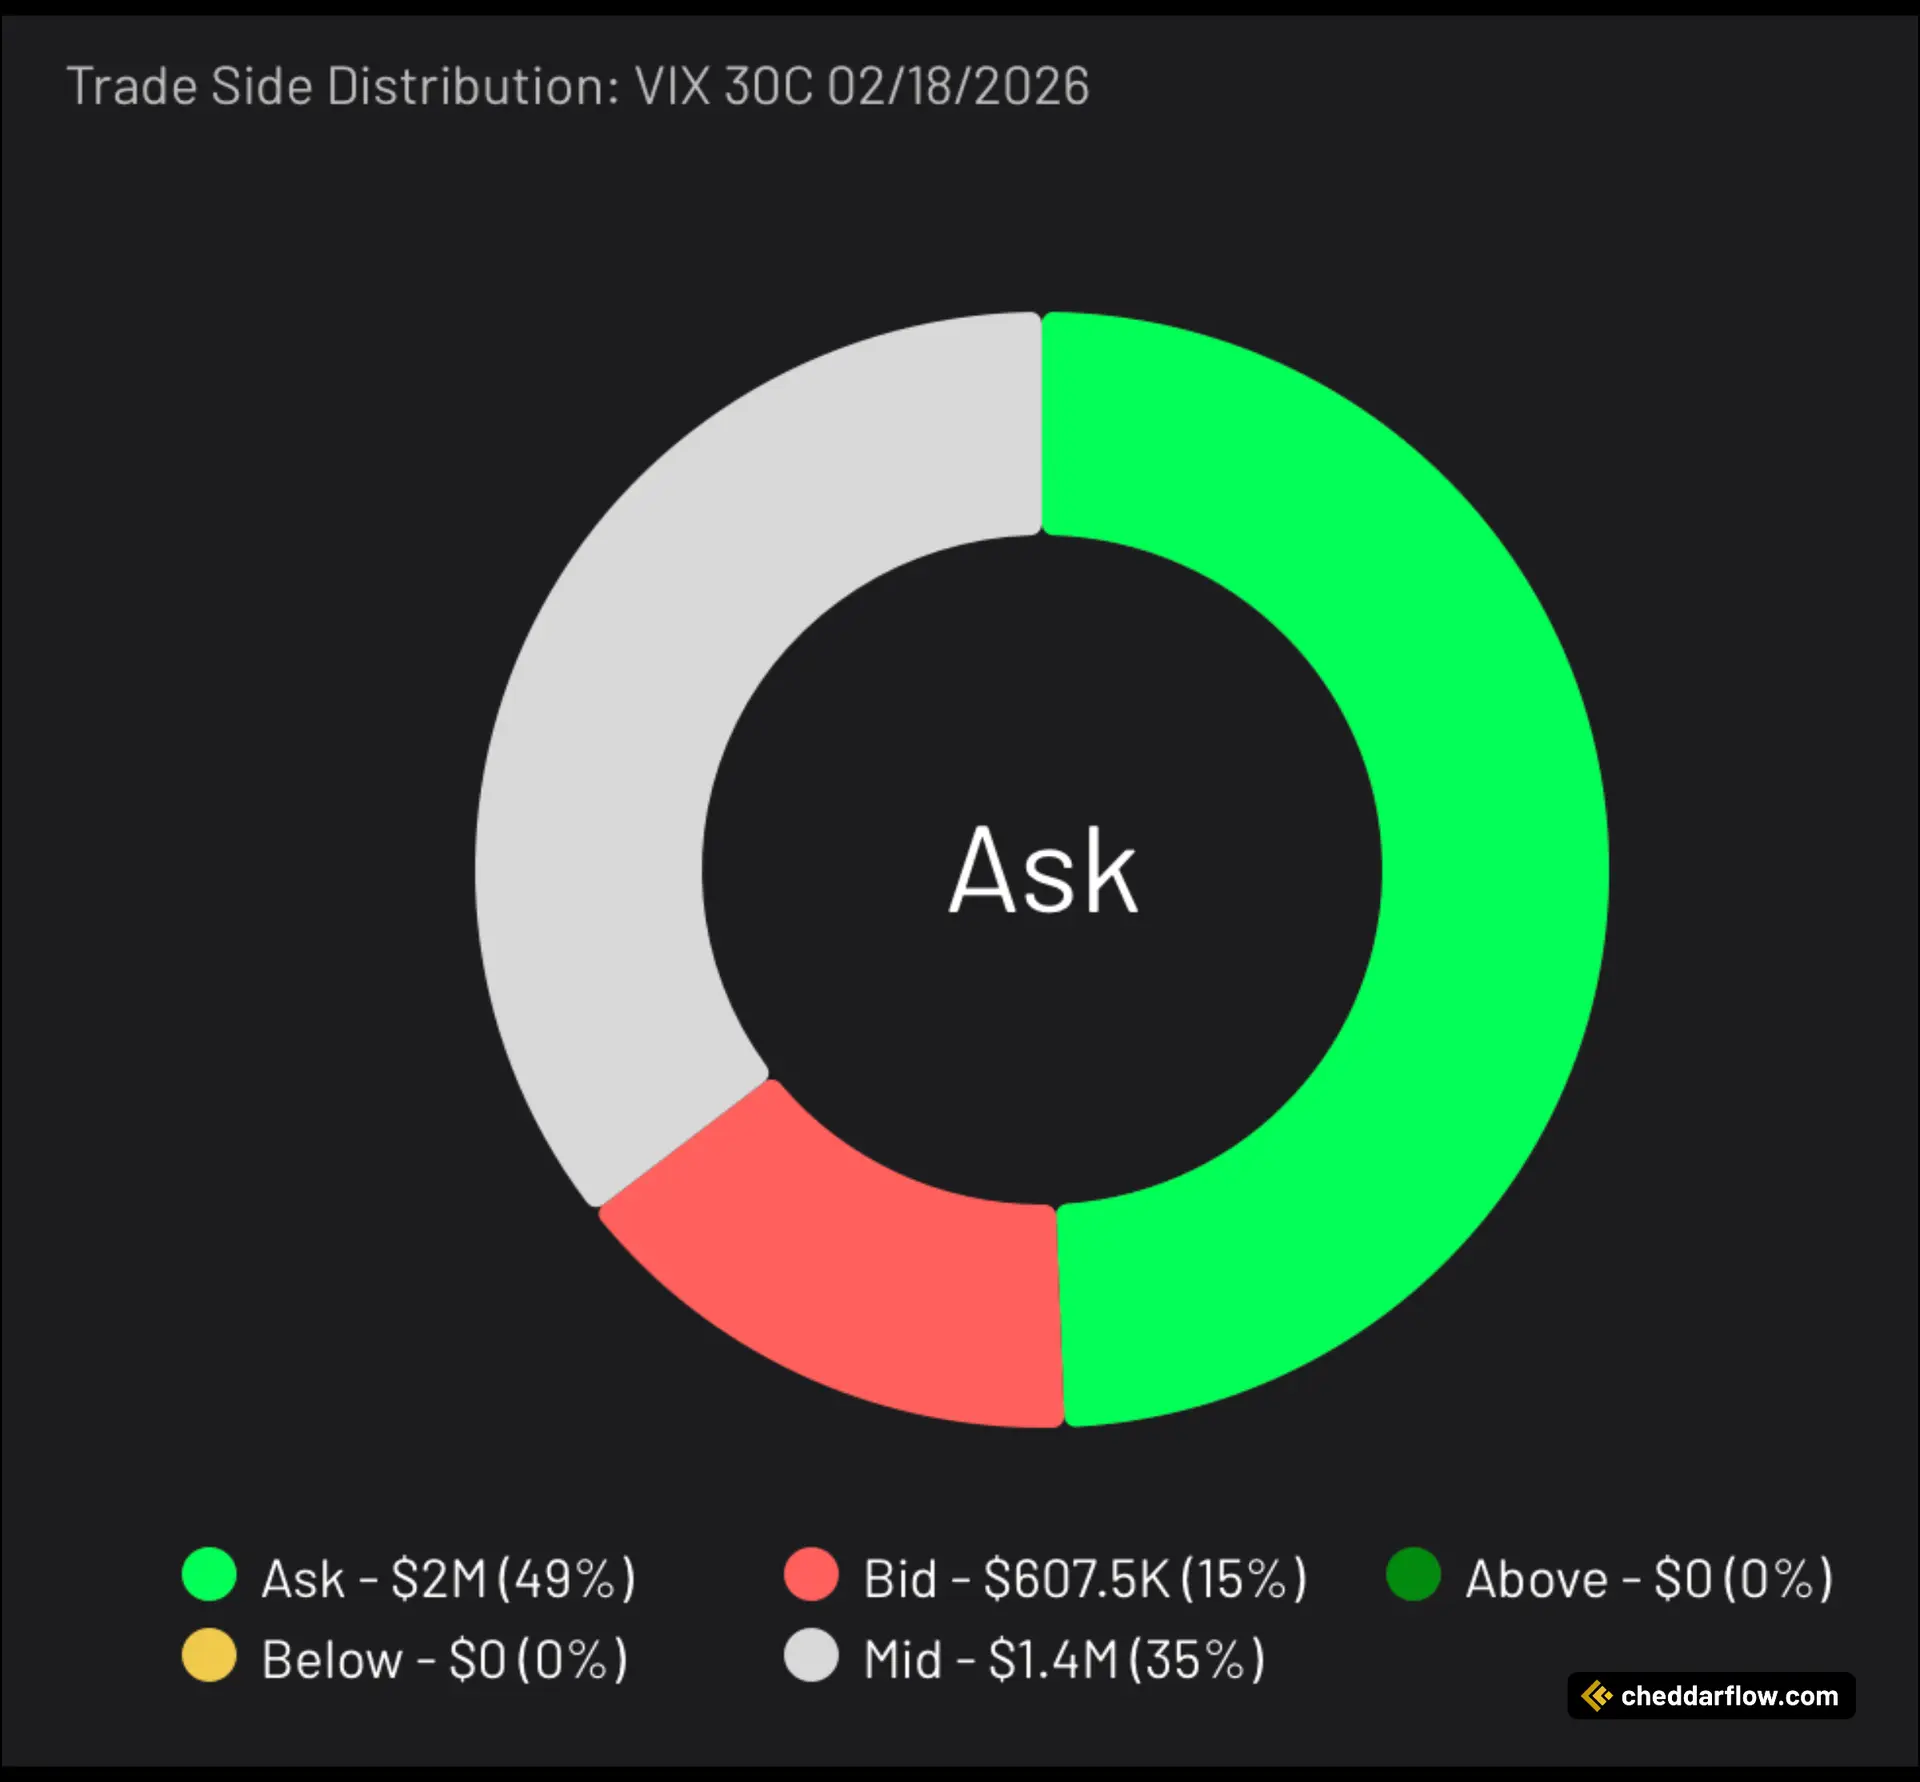
The trade side distribution for the VIX February 18, 2026 $30 calls is decisively buyer-driven. The majority of premium transacted on the ask. Approximately $2.0M (49%) of total premium was paid at the ask, signaling aggressive buyers willing to cross the spread to secure exposure. An additional $1.4M (35%) traded at the mid, which still leans constructive and suggests negotiated accumulation rather than distribution.
Only $607K (15%) executed at the bid, indicating relatively limited selling pressure. Meanwhile, no volume traded above or below the market. Overall, this skew toward ask and mid executions strongly supports the view that this flow represents intentional accumulation of long volatility exposure. The distribution is consistent with institutional hedging or a forward-looking volatility thesis rather than short-term speculation or profit-taking.
What’s Happening with the VIX
The VIX, Wall Street’s fear gauge, has been trading below its long‑term historical averages as the market heads into the new year, reflecting a backdrop of subdued implied volatility and steady equity gains. Recent readings in the mid‑teens sit under the roughly high‑teens average seen over the past few decades. This suggests that investors are pricing in a relatively narrow range of expected short‑term moves for the S&P 500.
This low‑volatility environment has persisted despite intermittent spikes earlier in the year, reinforcing a narrative of investor complacency and calm going into year‑end, even as history shows that such periods can precede more pronounced volatility later on. VIX ETFs, which are designed to offer tradable solutions on the VIX index, have shown similarly consistent historical lows.
About the VIX
The CBOE Volatility Index (VIX) is Wall Street’s widely watched “fear gauge.” It represents the option market’s consensus view of how volatile the S&P 500 will be over the next 30 calendar days. It does so by aggregating real-time prices of a broad strip of near-term out-of-the-money S&P 500 index calls and puts. When those option premiums rise—signaling traders are willing to pay more for protection against, or participation in, large index moves—the VIX climbs. Likewise, when premiums fall, the VIX declines.
Importantly, the VIX is a forward-looking, implied-volatility measure, not a historical one. It is expressed in annualized percentage terms. So, a VIX reading of 20 implies roughly ±1.25 % daily moves in the S&P 500 over the coming month under a log-normal assumption. Investors use it both as a barometer of market sentiment and as a tradable instrument for hedging or speculating on near-term equity-market turbulence.
Want to see more of these trades? Try out Cheddar Flow free for 7 days. Learn More
Disclaimer: Options trading involves significant risk and is not suitable for all investors. You may lose the entire investment, and certain strategies may result in losses exceeding the initial amount invested. Past performance does not guarantee future results. This content is for informational purposes only and should not be considered investment advice. Always consult a financial or tax advisor before making investment decisions.