What is a Bullish Engulfing Pattern?
A bullish engulfing pattern is a technical analysis indicator of a potential reversal from a downtrend to an uptrend. It’s a two-candlestick pattern that appears on price charts.
This pattern is distinguished from a bearish engulfing pattern.
What it looks like

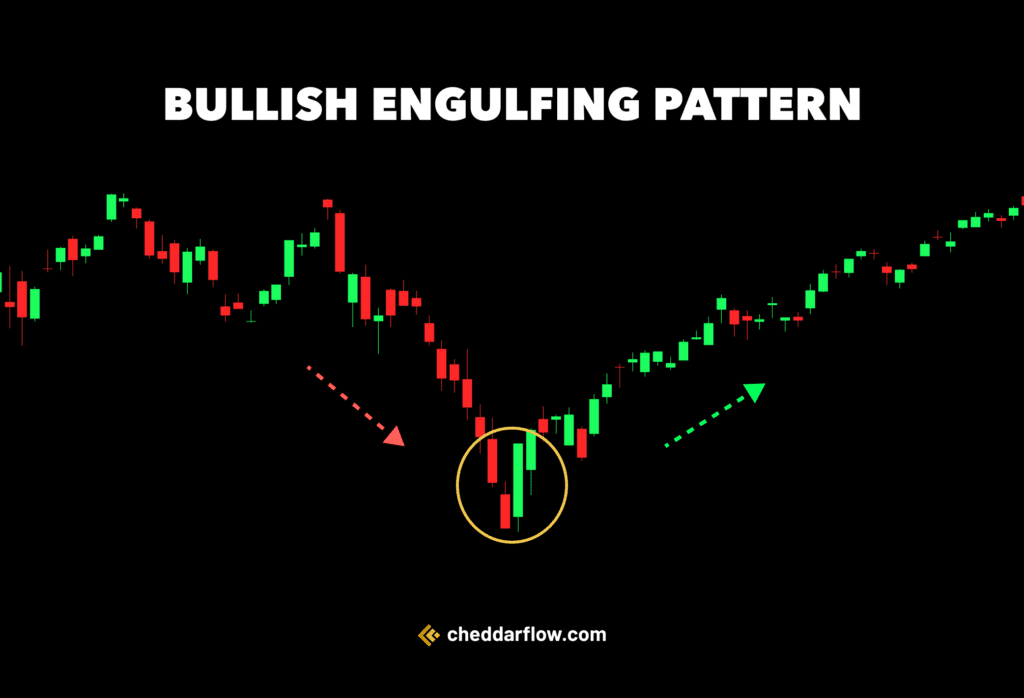
A bullish engulfing pattern has two candlesticks: a small, bearish candlestick is followed by a large bullish candlestick that swallows the first one entirely.
First candlestick: Bearish (typically black or red in color). It represents a downtrend. This candlestick should have a relatively small body and short wicks (shadows).
Second candlestick: Bullish (typically white or green in color). This candlestick is larger than the first one and completely engulfs the body of the bearish candlestick. Ideally, it should also engulf the wicks of the first candle.
Visualization example
Imagine two candlesticks on a chart.
- The first candlestick is typically black or red, with a small body and short wicks, indicating a downtrend.
- This is followed by a larger white or green candlestick, engulfing the body of the previous candle entirely. The second candlestick’s opening price is lower than the first candlestick’s closing price, and its closing price is higher than the first candlestick’s high point.
This signifies that the sellers were initially in control (driving the price down), but the bulls (buyers) stepped in and pushed the price up significantly by the day’s end.
What the Bullish Engulfing Pattern tells us
Answer: It tells you that there might be a shift in the market from a downtrend to an uptrend. It suggests that after a period of selling pressure, buyers are stepping in and pushing prices higher.
This could be a signal for traders to consider entering long positions (buying an asset in anticipation of its price going up).
Simple Breakdown
- Downtrend Exhaustion: The first bearish candlestick signifies a downtrend where sellers are in control. The small body suggests weakening selling pressure, potentially indicating the downtrend is losing momentum.
- Bulls Emerge: The second, larger bullish candlestick represents a surge in buying activity. By engulfing the prior bearish candle, it shows buyers are overpowering sellers and pushing the price significantly higher. Ideally, a small upper wick on the bullish candle suggests the price closed near its high, indicating strong buying throughout the trading period.
- Potential Trend Reversal: This shift in dominance from sellers to buyers suggests a possible reversal from the downtrend. The strength of the bullish engulfing pattern depends on the length and intensity of the preceding downtrend. A longer downtrend followed by a strong engulfing pattern suggests a higher chance of a sustained uptrend.
The pattern indicates a potential reversal, not a guaranteed one. False signals can occur, so confirmation from other technical indicators or increased trading volume is recommended. A bullish engulfing pattern dives deeper into the psychology of the market sentiment.
And then… The engulfing pattern appears after the price movement, so it doesn’t predict the reversal, but rather reflects it.
Real Example: Bullish Engulfing Candle
We’ll use the S&P 500 (SPY) for this quick example.
- Pattern: Bullish Engulfing
- Explanation: SPY showed a bullish engulfing pattern. This pattern formed when the candlestick opened lower than the previous day’s close but closed higher than the previous day’s high, completely engulfing the previous day’s candle.
This suggests a potential reversal from a downtrend to an uptrend.
In the example:
- The first candlestick was bearish, indicating selling pressure.
- The second candlestick opened lower than previous days close but rallied strongly throughout the day, closing above previous day’s high.
This pattern is significant as it often indicates a shift in market sentiment from bearish to bullish, potentially signaling a buying opportunity for traders looking for reversal patterns.
Pros & Cons of the Bullish Engulfing Candle
| पेशेवरों | दोष |
|---|---|
| Indicates a potential trend reversal from downtrend to uptrend | Not a guaranteed reversal signal, false signals can occur |
| Relatively simple to identify on price charts | Lagging indicator, reflects price movement after it happens |
| Can be used with other technical indicators for confirmation | Strength of the signal depends on context like preceding trend |
The bullish engulfing pattern offers a visually simple way for traders to identify potential trend reversals from downtrends to uptrends.
While it can provide entry and stop-loss placement points, it’s not a guaranteed signal and can lead to false positives.
For stronger confirmation: You should combine it with other technical indicators and consider the overall market context.
अक्सर पूछे जाने वाले प्रश्नों
What does a bullish engulfing candle mean?
A bullish engulfing candlestick pattern typically indicates a potential reversal of a downtrend. It forms when a larger bullish candle completely engulfs the previous smaller bearish candle, suggesting increased buying momentum and potential upward movement in the market.
How to confirm bullish engulfing?
To confirm a bullish engulfing pattern:
- Volume Confirmation: Look for higher trading volume on the bullish engulfing day compared to the previous day.
- Follow-through: Ideally, the next day should show further upward movement or a green candle to validate the bullish sentiment established by the engulfing pattern.
What is the engulfing candle rule?
The engulfing candle rule states that for a bullish engulfing pattern: The second (bullish) candle must completely engulf the body of the first (bearish) candle.