Most retail traders approach market downtrends the wrong way. When the S&P 500 begins an aggressive selloff, traders often stare at 1-minute or 5-minute charts, trying to catch a falling knife based on pure price action. This approach usually leads to getting stopped out repeatedly. If you want to trade market reversals with high probability, you need to stop trading price action in a vacuum and start tracking SPY gamma exposure.
Gamma exposure (GEX) reveals the exact price levels where options market makers are forced to buy or sell massive amounts of stock to hedge their books. When you combine extreme levels of negative gamma with technical confluence, you can identify high-probability support levels that hold up even in the most aggressive downtrends. In this guide, we will break down exactly how to use SPY gamma exposure to find low-risk, high-reward bounce trades.
Understanding SPY Gamma Exposure and Put Walls
To trade market reversals effectively, you must understand the mechanics of a put wall. A put wall is a specific strike price that holds a massive concentration of negative gamma exposure. When retail and institutional traders buy put options to protect their portfolios during a selloff, market makers sell those puts. To remain delta-neutral, market makers must short the underlying stock (SPY) as the price falls.
However, when the price approaches a massive put wall, the dynamics change. The sheer size of the options open interest at that strike acts as a magnet and a floor. Market makers adjust their hedges, and the intense selling pressure often exhausts itself exactly at that level. According to historical options flow data, any SPY strike with over $3 billion to $4 billion in negative gamma exposure represents a highly significant support level.

The Biggest Mistakes Traders Make with Gamma Levels
Before executing a trade based on SPY gamma exposure, you must eliminate the common mistakes that cause retail traders to fail even when they have the right data:
- Using the wrong timeframes: Trying to scalp a massive gamma level using a 1-minute or 5-minute chart is essentially gambling. The noise on these micro-timeframes will shake you out of a good position. You must use a 15-minute chart at a minimum, and rely on the hourly chart for true confirmation.
- Stopping out on intraday wicks: Market makers will often push the price slightly below the put wall intraday to trigger retail stop losses before reversing the price. You must wait for an hourly candle close below the level to confirm a breakdown.
- Ignoring gap downs: If the market gaps down below the key support level the following morning, the setup is invalidated. You must stop out immediately rather than hoping for a recovery.
The Strategy: Trading the Gamma Bounce with Confluence
Gamma data is powerful, but it should never be traded in isolation. The highest probability trades occur when SPY gamma exposure aligns with traditional technical indicators. The most effective indicator to pair with a massive put wall is the Relative Strength Index (RSI) on a daily timeframe.

When SPY approaches a $4 billion put wall while the daily RSI is simultaneously flashing an extreme oversold reading (under 30), you have a prime setup for a reversal. The market is stretched too far to the downside, and dealer hedging dynamics are poised to step in and catch the fall.
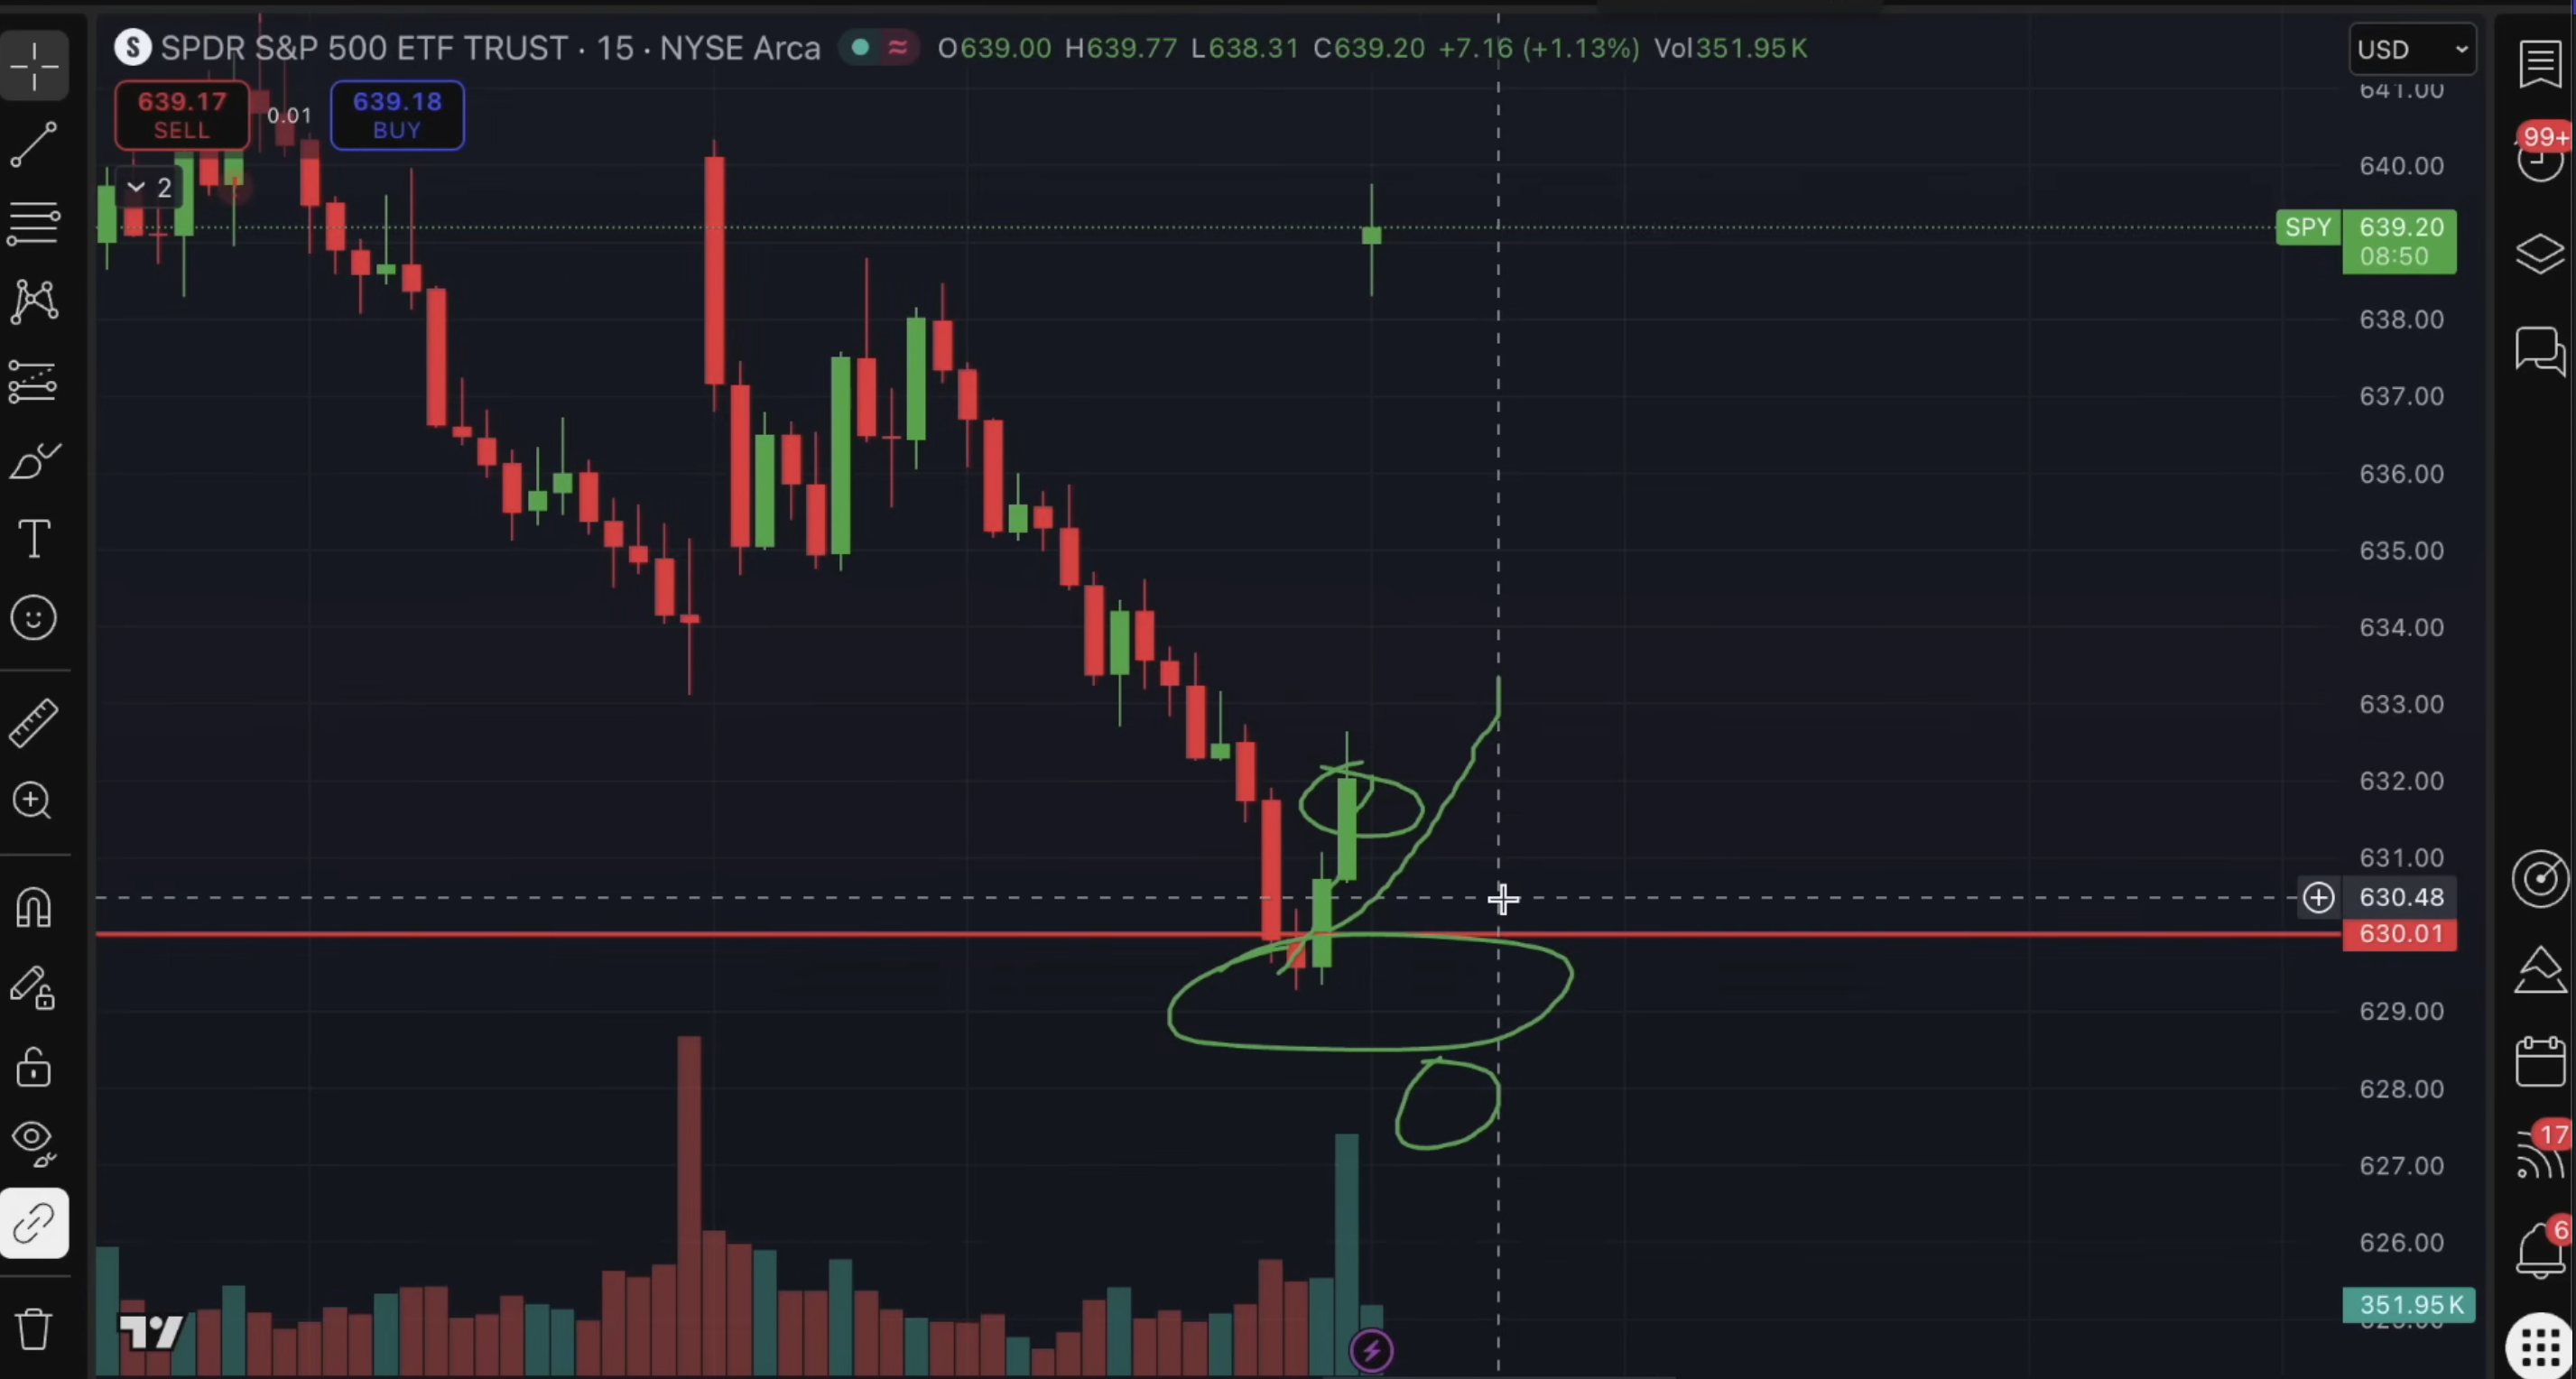
Real-World Case Study: The 630 SPY Put Wall
Let’s look at a real-world example of this strategy in action. SPY was in an aggressive downtrend, bleeding heavily over several days. However, the gamma exposure data revealed a massive $4.2 billion put wall sitting exactly at the 630 strike. The daily RSI was at 26, indicating severe oversold conditions.

The execution strategy is precise:
- Entry: Go long (buy Calls) as SPY tests the 630 level.
- Stop Loss: Set a 1-to-2 point buffer below the level (628 to 629). Crucially, this stop is only triggered if an hourly candle closes below the buffer zone.
- Risk Management: As the price bounces and moves in your favor (e.g., hitting 632 or 633), trim 1/3 to 1/2 of your position to secure profits. Then, move your stop loss on the remaining runners to your breakeven entry price. This creates a “free trade” that you can hold overnight without risk.

The Result: A Risk-Free Gap Up
Because the trader trimmed profits at 632 and moved their stop loss to breakeven, they were able to hold the remaining position overnight with zero risk. The following morning, the mechanics of the put wall played out perfectly. Market makers unwound their short hedges, and the market gapped up significantly.
This trade illustrates why trading pure price action during a selloff is inferior to trading options flow data. Price action traders saw a terrifying downtrend and likely shorted the bottom or stayed on the sidelines. Gamma data traders saw a $4 billion put wall and an oversold RSI, giving them the confidence to step in and buy the exact low.
To learn more about how institutional traders use these levels, Investopedia’s guide to options Greeks provides the foundational knowledge required to understand market maker hedging.
Stop Guessing, Start Tracking Gamma
If you are tired of getting chopped up in volatile markets, it is time to upgrade your toolkit. By identifying massive put walls and pairing them with basic technical confluence like an oversold RSI, you can build a systematic, low-risk approach to trading market reversals. Stop trading SPY blindly, and start trading the data that actually moves the market.
Want to see real-time SPY gamma exposure levels before you take your next trade? Try out Cheddar Flow free for 7 days and get access to the exact dashboard used in this strategy. Learn More
Disclaimer: Options trading involves significant risk and is not suitable for all investors. You may lose the entire investment, and certain strategies may result in losses exceeding the initial amount invested. Past performance does not guarantee future results. This content is for informational purposes only and should not be considered investment advice. Always consult a financial or tax advisor before making investment decisions.