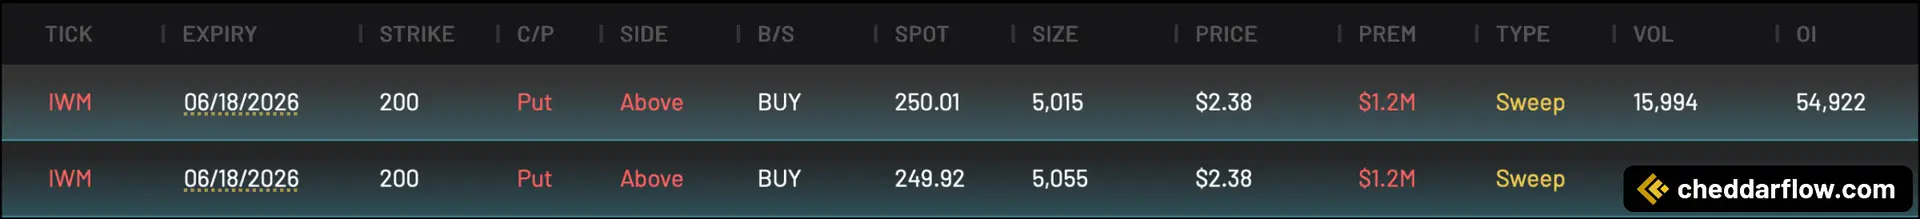
The image shows back to back large IWM $200 put sweeps expiring June 18, 2026, indicating a sizable options position. The trades were executed above the ask (aggressive buying), with a total premium of roughly $1.2M per sweep. This suggests around $2.4M combined if both prints are part of the same order flow. At the time of these trades, volume sat at 15,994 contracts versus open interest of 54,922. This translates to a V/OI ratio of ~0.29, which is notable but not extreme—implying this is a meaningful addition to existing positioning rather than a completely new bet.
With IWM trading around $250 at the time of execution, the $200 strike is deeply out-of-the-money. This signals a strong hedge or speculative bet targeting a significant move lower. The expiration is roughly 2.5–3 months out, giving the trade time to play out, potentially tied to macro risks or broader market weakness. Overall, the aggressive execution and multi-million-dollar premium suggest institutional-level conviction.
Volume and Open Interest Data
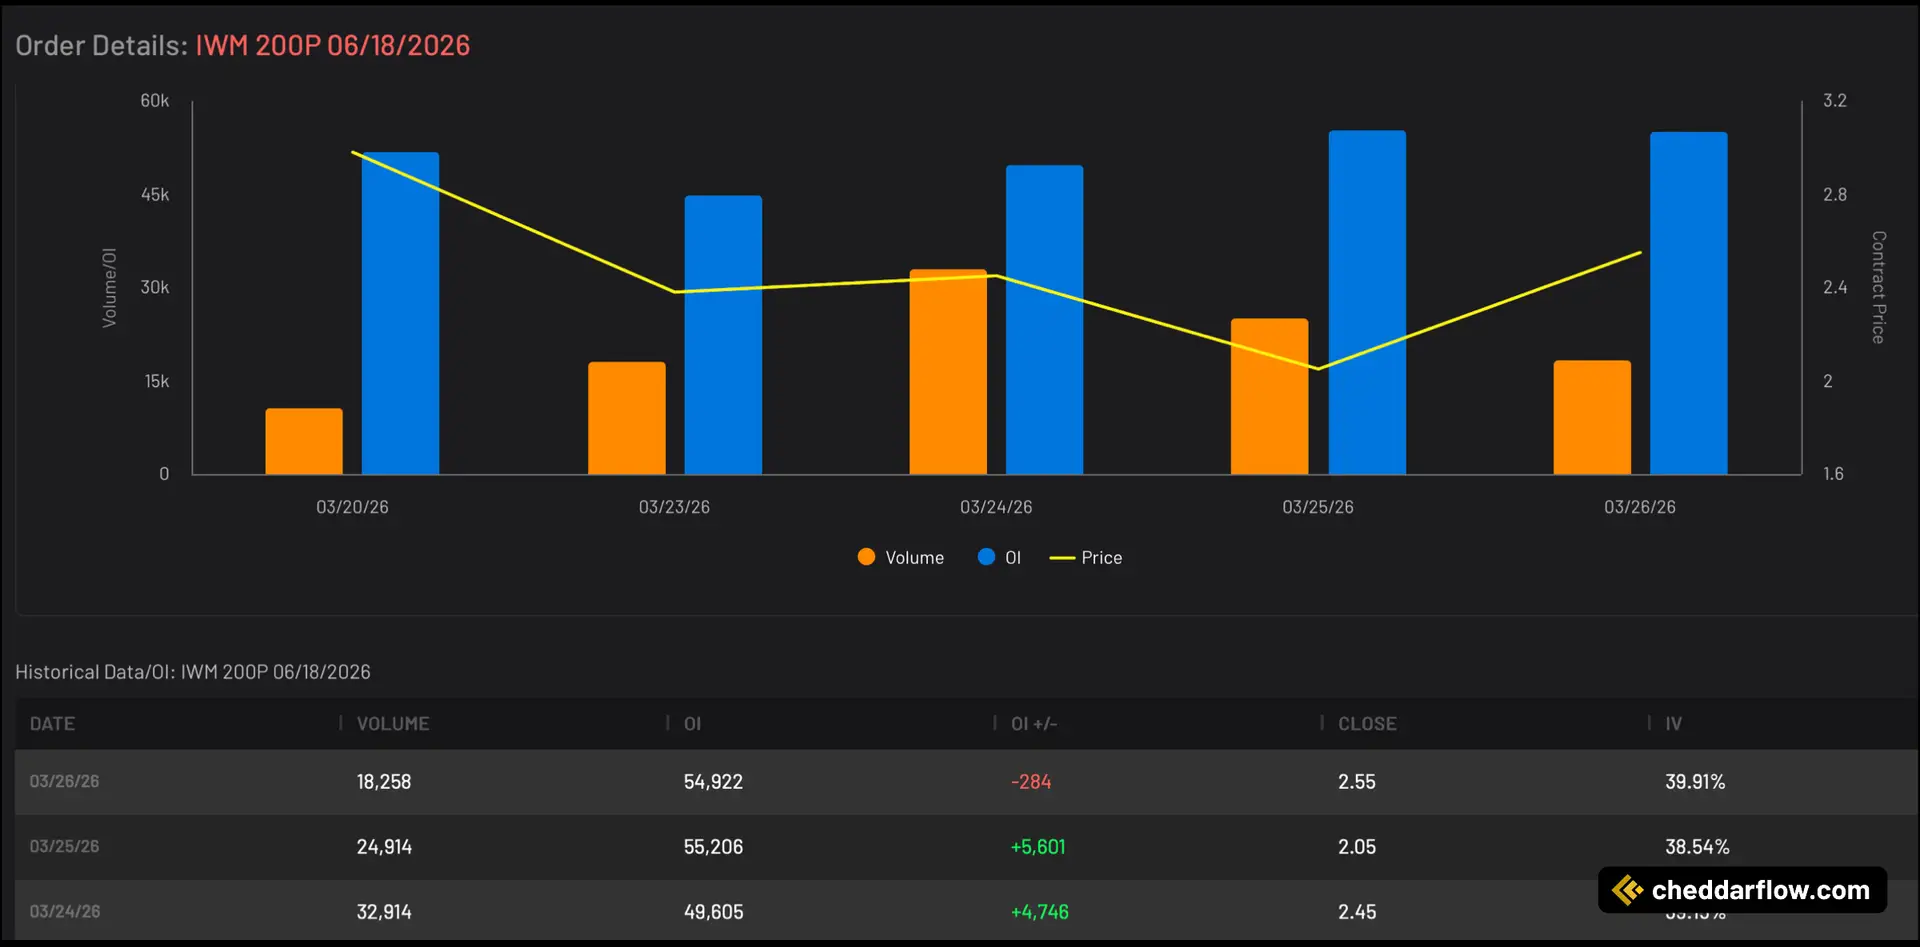
The chart shows consistent elevated activity in the IWM $200 puts (06/18/2026) over several trading days. Volume repeatedly printed at significant levels relative to open interest. Notably, on 03/24 and 03/25, volume surged (~33K and ~25K respectively) alongside strong increases in open interest (+4,746 and +5,601). This indicates new positions being opened rather than closing trades. This suggests fresh positioning or hedging activity entering the market.
By 03/26, volume remained elevated (~18K), but open interest slightly declined (-284). This could potentially indicate some profit-taking or position adjustments. Meanwhile, option prices fluctuated but generally held firm, while implied volatility trended slightly higher, reinforcing continued demand for exposure. Overall, the data points to sustained institutional interest building in these puts, with earlier sessions showing clear accumulation followed by more mixed activity in the most recent session.
Trade Side Distribution
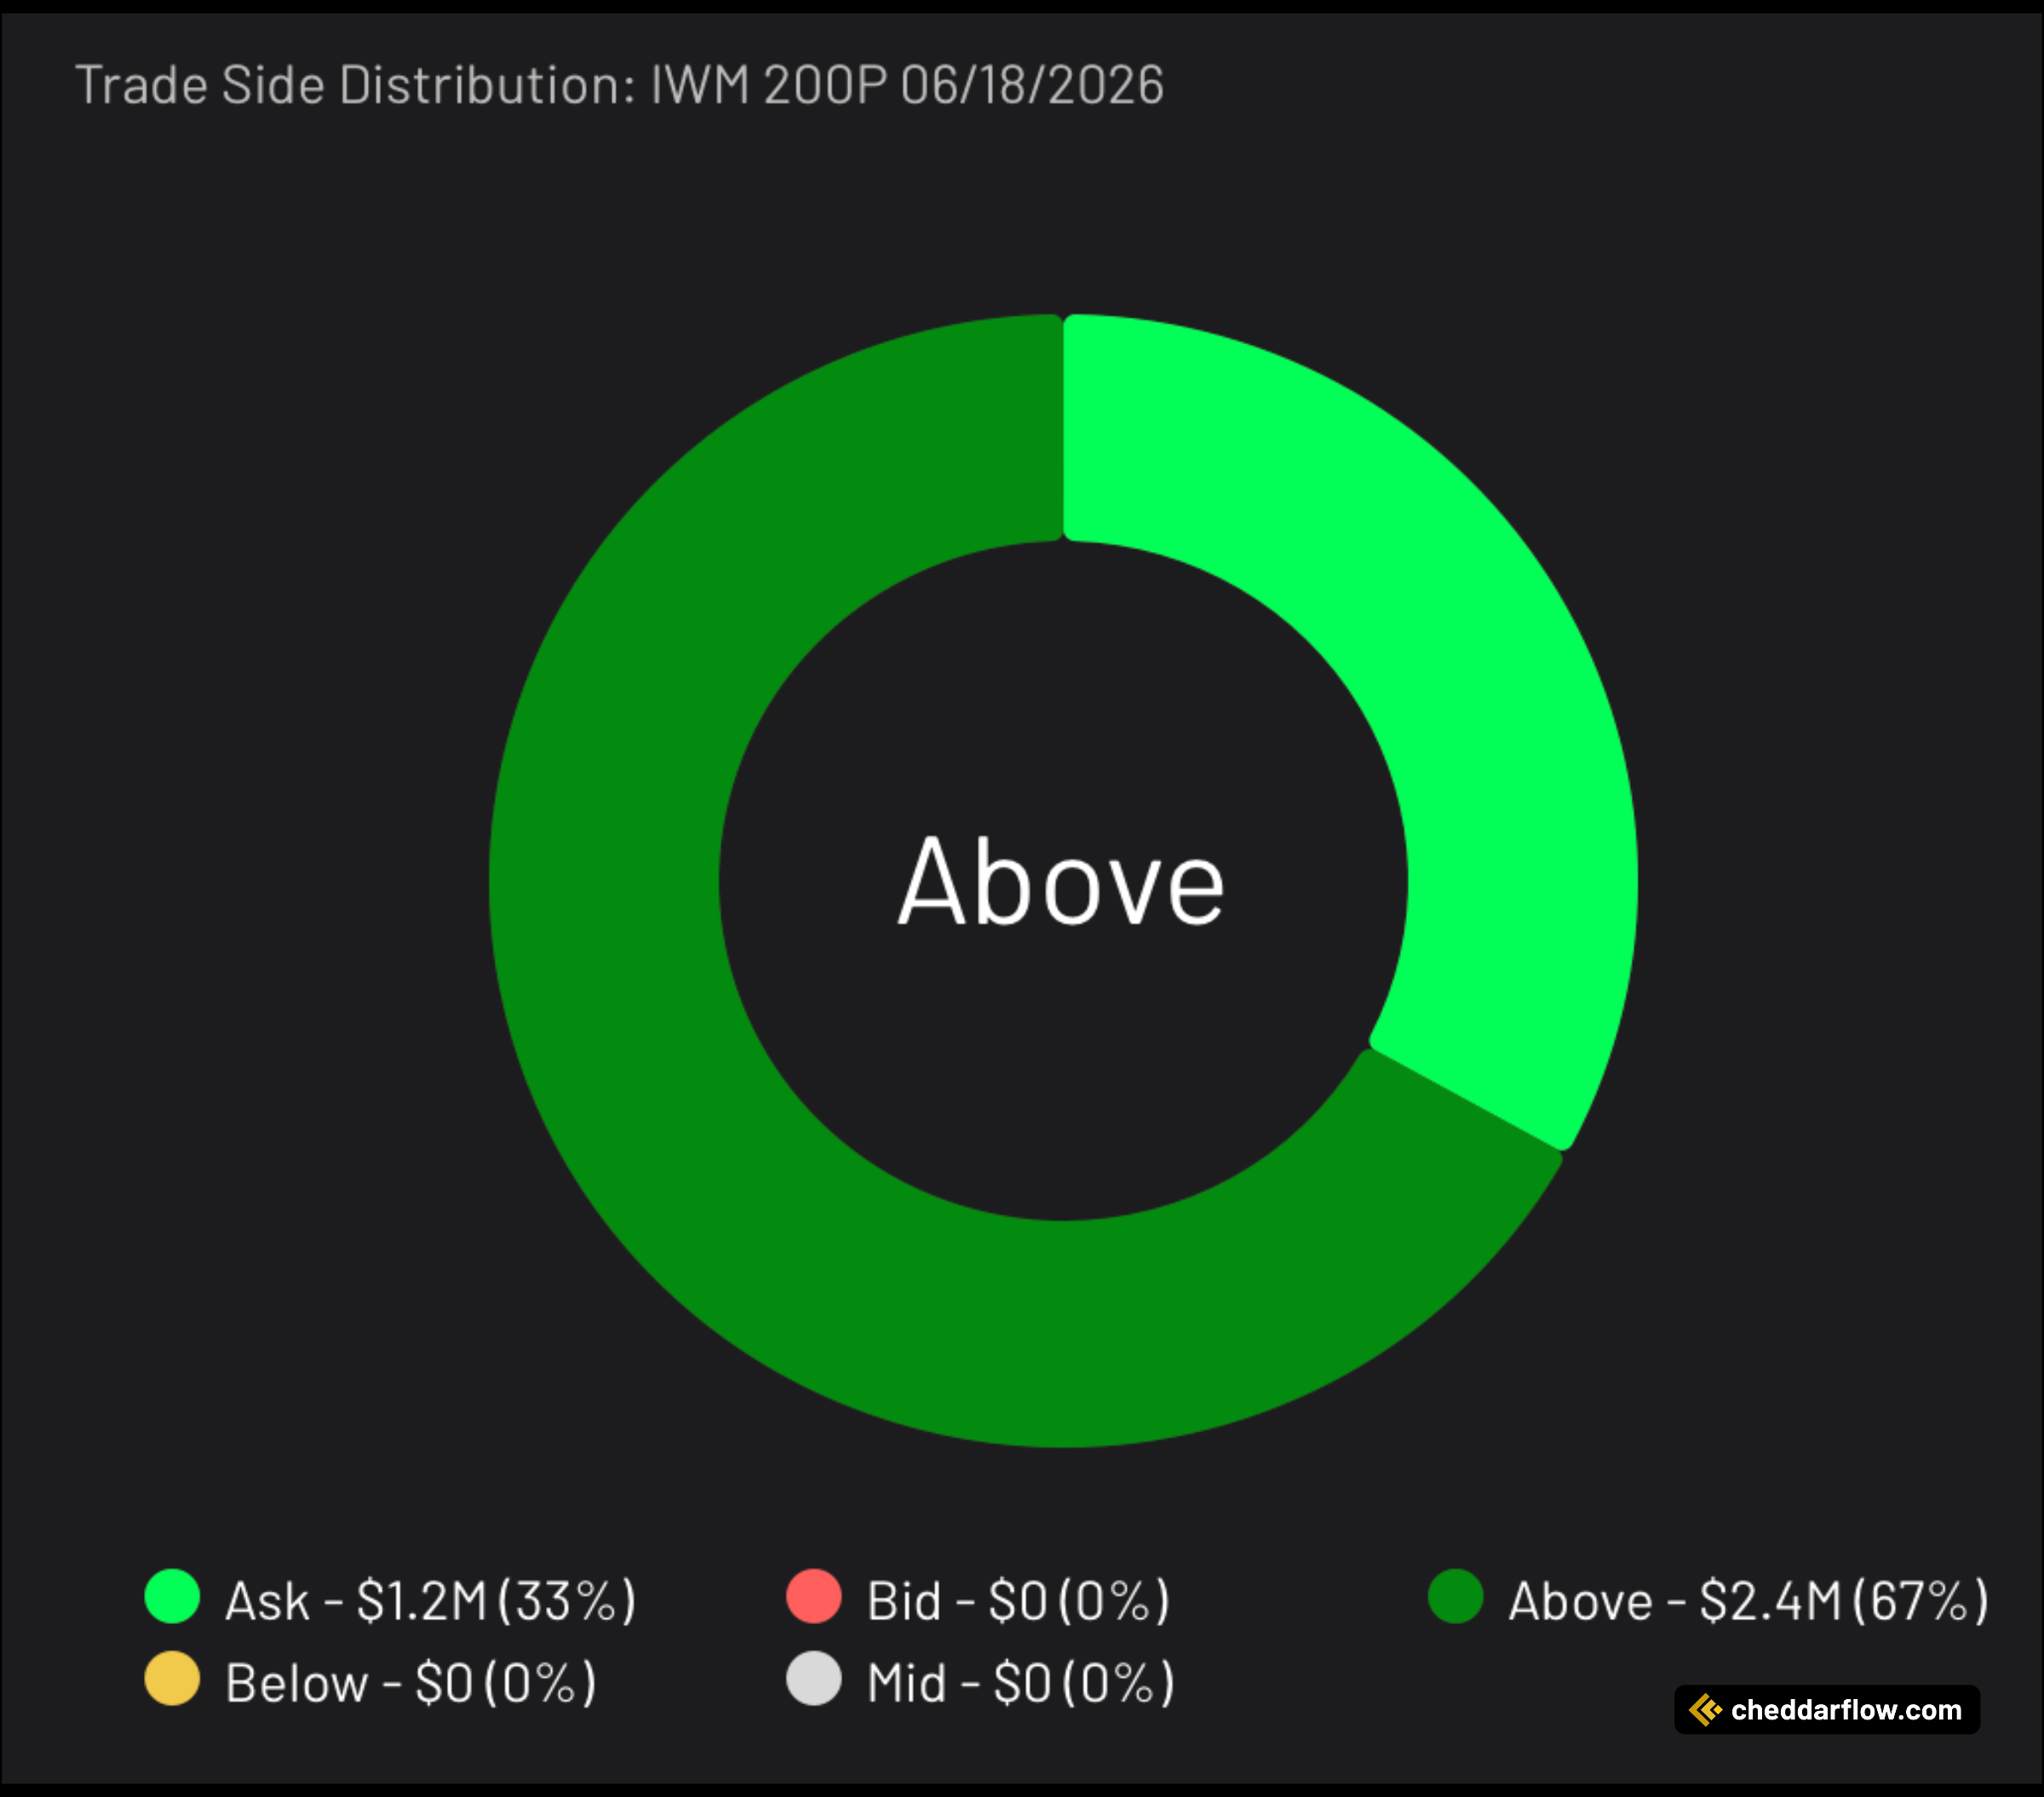
The trade side distribution for the IWM $200 puts (06/18/2026) shows a clear dominance of aggressive buying activity. Approximately 67% of the premium ($2.4M) was executed above the ask, with the remaining 33% ($1.2M) filled at the ask, and no volume hitting the bid or mid.
This strongly indicates that buyers were willing to pay up to enter positions, reflecting urgency and conviction behind the flow. The absence of selling pressure suggests these trades are likely driven by new bets or hedging. This reinforces the idea of institutional participants positioning for potential weakness in small-cap equities.
What’s Happening with IWM
The Russell 2000 has kicked off 2026 with a strong rally, setting a series of new record highs while materially outperforming the S&P 500 and Nasdaq‑100 in the opening months of the year. This surge reflects renewed risk appetite and investors rotating into U.S. small‑caps on expectations of easier monetary policy, firmer domestic growth, and improving earnings guidance among smaller companies.
Fundamentally, earnings for Russell 2000 constituents are rebounding from a low base, with blended year‑over‑year profit growth estimates above 60%. Some strategists, however, argue that consensus EPS projections look overly optimistic and that small‑cap earnings remain a “show‑me” story. Several banks and index providers still see room for further upside in 2026 but frame recent strength as more of a trade than a durable leadership shift. They flag elevated valuations, overbought technicals, and sensitivity to interest‑rate and credit conditions as key risks to the rally.
About IWM
The Russell 2000 is a stock market index that tracks the performance of 2,000 small-cap U.S. companies. It serves as a key benchmark for the domestic economy and investor risk appetite. Unlike the S&P 500, which focuses on large-cap companies, the Russell 2000 reflects the health and growth potential of smaller businesses. Many of these companies are more sensitive to interest rates and economic cycles.
As a result, it often acts as a leading indicator during market transitions. Traders and investors watch the index closely for signals on market breadth and sentiment. The index is widely followed through the IWM ETF, a popular vehicle for trading small-cap exposure.
Want to see more of these trades? Try out Cheddar Flow free for 7 days. Learn More
Disclaimer: Options trading involves significant risk and is not suitable for all investors. You may lose the entire investment, and certain strategies may result in losses exceeding the initial amount invested. Past performance does not guarantee future results. This content is for informational purposes only and should not be considered investment advice. Always consult a financial or tax advisor before making investment decisions.